Bitcoin Breakout Analysis: Price Consolidates Near All-Time Highs

This Bitcoin breakout analysis examines the current BTC/USDC structure in the context of support defense and weakening alternative frameworks. BTC/USDC is currently exhibiting significant strength, trading near $79,000 after a powerful rally that has pushed momentum indicators into overbought territory. The daily RSI stands at an elevated 80.59, while the ADX at 36.48 confirms a strong, established trend is in place. Price action has decisively broken above key long-term moving averages and is now undergoing a period of high-level consolidation just below major historical resistance. This technical strength aligns with recent market analysis, which highlights a significant sentiment shift from fear to pronounced greed, fueling the current speculative interest. The market structure now presents a critical test: whether this consolidation is a pause before a new upward leg or a sign of exhaustion at a pivotal price ceiling. The following analysis explores three technical frameworks—Range/Rebound, Breakout, and Continuation—to interpret the current structure.
Range & Rebound: Market Structure Assessment
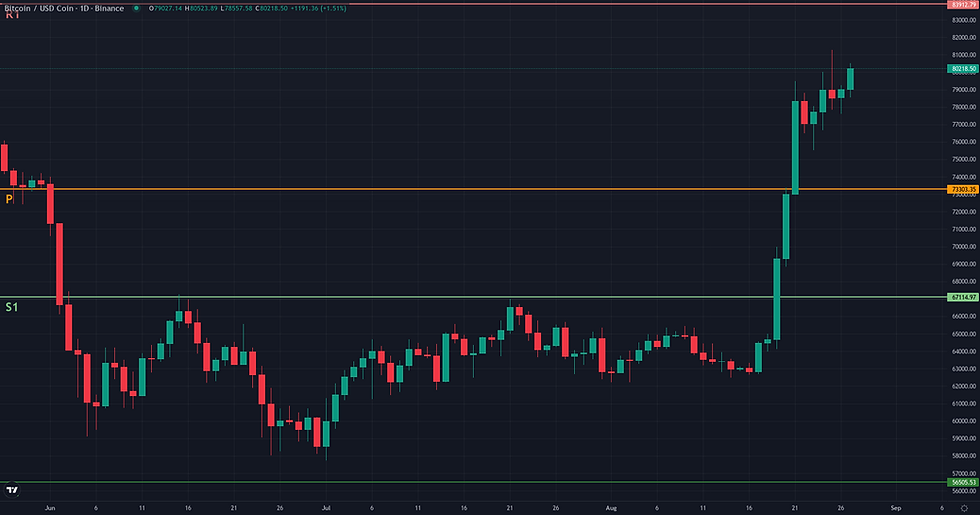
The Range/Rebound framework is assessed as not plausible in the current market context. This framework is designed to identify potential stabilization and reversal opportunities near significant support levels following a corrective or downward phase. The current structure for BTC/USDC presents the opposite scenario: a powerful, impulsive uptrend. Over the last ten sessions, the price has surged from approximately 62,800 to above 79,000, a move characterized by strong momentum rather than stabilization. Key indicators confirm this dynamic: the daily RSI is deep in overbought territory at 80.59, and the ADX at 36.48 signals a strong, established trend. Price is trading significantly above all major reference points, such as the daily 200 EMA (72,003) and the weekly Bollinger Band middle line (69,512), treating them as distant support rather than immediate rebound zones. For the Range/Rebound framework to become relevant, the market would first need to undergo a significant correction, establish a clear support level, and show signs of bullish momentum exhaustion.
Bitcoin Breakout Analysis: Structural Catalyst Assessment
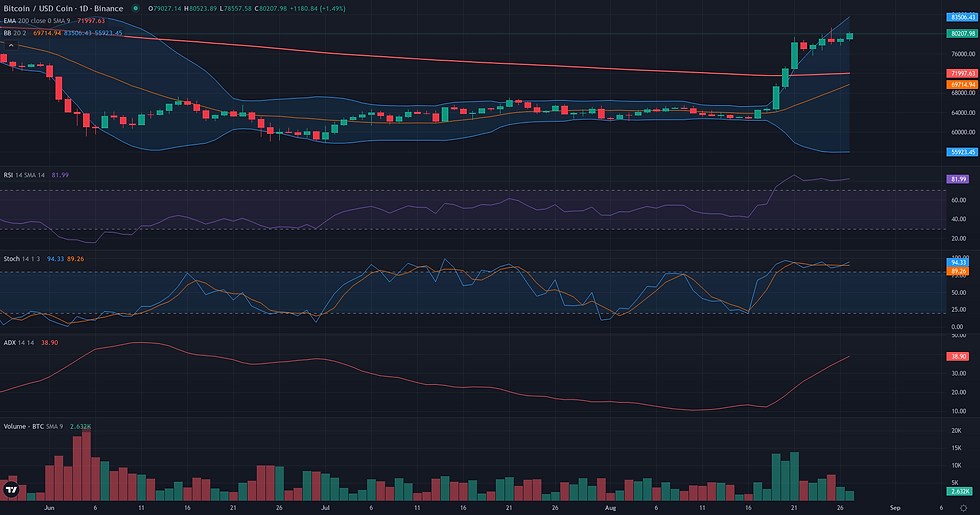
The Breakout framework appears technically plausible for BTC/USDC. The market structure displays a powerful structural rupture, having decisively broken out of a multi-week consolidation range that was capped around the 65,000 level. This initial impulse, which occurred around August 19th, was characterized by a significant expansion in both volume and volatility, aligning with the framework's core signature. Currently, the price is engaged in a high-level consolidation, holding its gains and trading just below the major historical resistance marked by the previous all-time high of 82,846.15. This period of stability after a strong directional move is often interpreted as a preparation phase for a potential continuation. The underlying trend strength is confirmed by a high ADX D1 reading of 36.48, and the weekly context remains supportive with a non-overbought RSI. The primary limiting factor is the immediate proximity to this major resistance, coupled with an overbought D1 RSI at 80.59, which signals a risk of short-term exhaustion. However, the clarity of the initial structural break and the subsequent constructive consolidation provide a solid foundation for the breakout thesis.
Continuation: Directional Flow Assessment
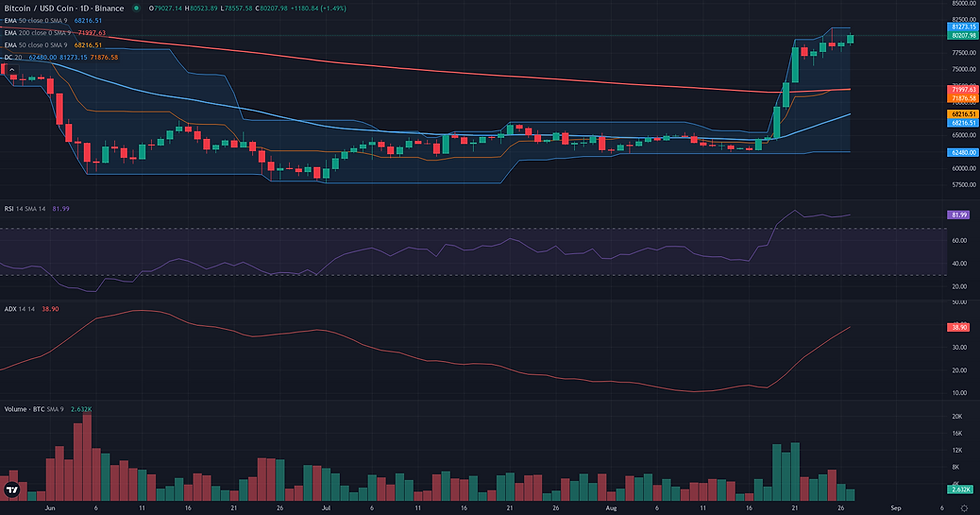
The technical structure for BTC/USDC presents a plausible continuation scenario. The market has recently established a powerful directional flow, evidenced by a sharp impulsive wave on the daily chart that broke out of a multi-week consolidation. This move is contextually supported by the weekly chart, where a decisive breakout candle has reclaimed the key W1 EMA 50 at 77268.17, reinforcing the bullish bias. Currently, the price is undergoing a high-level consolidation, holding its gains well above the breakout point. This sideways action is constructive, suggesting a pause to absorb supply before a potential next leg higher. Momentum indicators are strong, with the D1 ADX at 36.48 confirming a trending environment. The primary factor requiring caution is the elevated D1 RSI at 80.59, which indicates an overbought condition. While this highlights the risk of a potential pullback, in the absence of any bearish divergence, it is currently interpreted as a sign of strength within a robust uptrend.
Comparative Framework Verdict
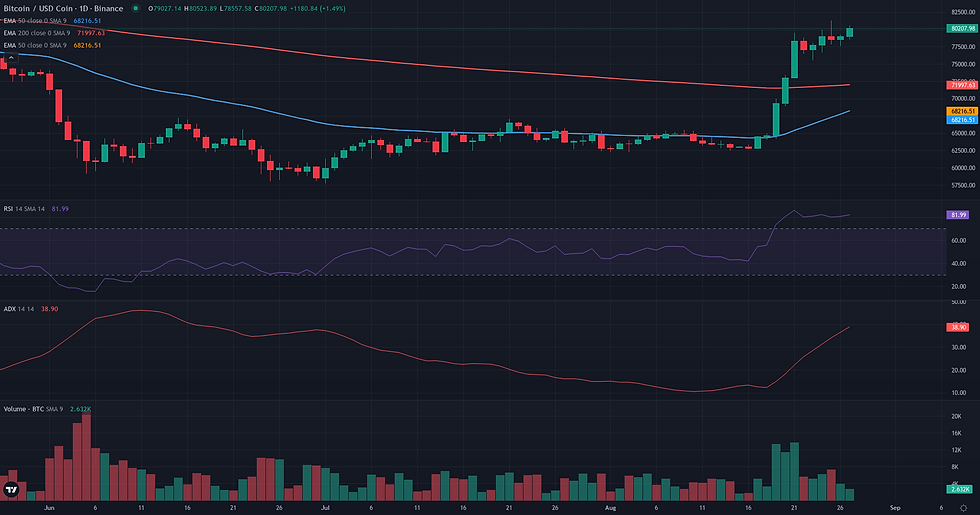
Comparing the three technical frameworks reveals a clear consensus centered on bullish momentum, with two plausible scenarios against one invalid one. The Breakout framework emerges as the most dominant interpretation. It compellingly frames the current price action as a constructive consolidation just below the prior all-time high of approximately 82,846, a classic pattern that often precedes a major structural rupture. The initial impulse out of the previous multi-week range provides a strong foundation for this thesis. Following closely is the Continuation framework, which is also assessed as plausible. It shares the same bullish outlook but focuses more tactically on the immediate consolidation range. Its validation hinges on a break above the recent local high near 81,273, which would signal the resumption of the current uptrend. These two frameworks essentially describe different stages of the same potential bullish move. Conversely, the Range/Rebound framework is deemed not plausible. The market's strong directional trend, confirmed by a high ADX and overbought RSI, is fundamentally at odds with the conditions of seller exhaustion and stabilization required for a rebound. The critical question for the market is whether the current pause will resolve upwards, validating the Breakout and Continuation scenarios, or if overbought conditions will force a deeper pullback before any further advance.
For broader market context, readers can also review the latest related fundamental analysis for this pair.
For live market monitoring and the full interactive chart, readers can access the dedicated BTC Market Hub.
Disclaimer
CopyTradia provides technical analysis for informational and educational purposes only. This content does not constitute financial advice, investment recommendations, or trading signals. Cryptocurrency markets are highly volatile. Past performance is not indicative of future results. Always conduct your own research (DYOR) and consult a qualified financial advisor before making any investment decisions.


