Bitcoin Bearish Continuation Analysis: Trend Dominates

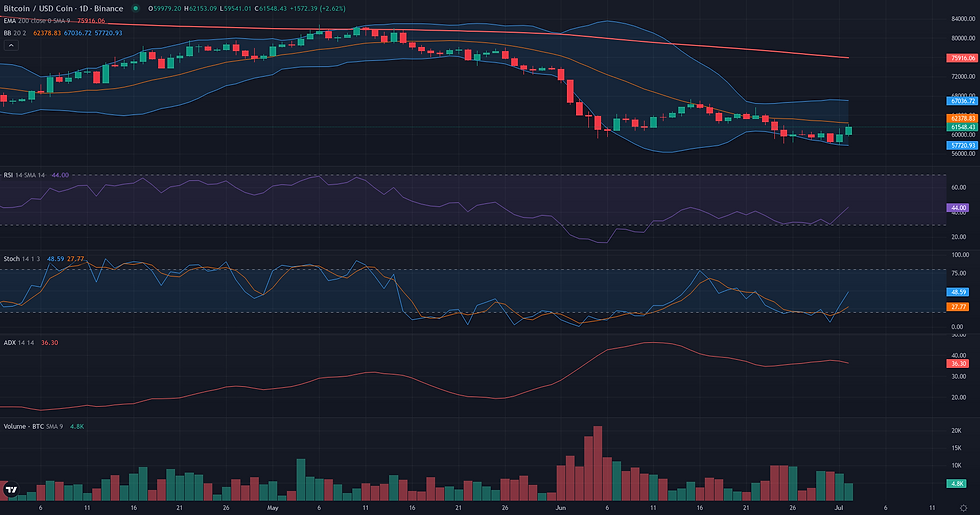
This Bitcoin bearish continuation analysis examines the current BTC/USDC structure in the context of support defense and weakening alternative frameworks. Bitcoin is navigating a critical juncture, with its price consolidating near the $60,000 level after a sharp rejection from lows around $58,000. The broader technical picture remains decidedly bearish, as confirmed by a high daily ADX of 37.28, which signals a strong and active downtrend. Momentum indicators reflect this pressure, with the daily RSI at 37.26 and the weekly RSI at 32.89, both indicating sellers are in control. The price remains significantly below key long-term averages like the daily 50-period EMA (66346.06), reinforcing the negative structural bias. This technical weakness is contextualized by recent fundamental analysis highlighting a market in contraction, driven by sustained price pressure and a prevailing sentiment of extreme fear. The current price action represents a test of major weekly support, and its outcome will likely define the market's direction in the near term.

Range & Rebound Resolution: Support and Friction Zones
The Range/Rebound framework for BTC/USDC hinges on the pivotal 61300 - 62500 validation zone. This area represents the immediate test for buyers attempting to build on the recent defense of major weekly support. The framework's coherence depends on holding the structural floor established around the July 1st low. Consequently, the invalidation zone is defined by a daily close below 57744.87. Such a move would signify a failure of the support cluster anchored by the weekly Lower Bollinger Band, negating the rebound thesis and suggesting a continuation of the dominant downtrend. Before any significant upside can be considered, the price must navigate several friction zones. The first is the validation zone itself, which contains the daily R1 pivot. A more formidable obstacle lies between 63200 and 64500, a confluence zone containing the daily R2 pivot (63227.75) and the weekly R1 pivot (64039.55). This area aligns with previous support from mid-June, which is now likely to act as strong resistance. If the rebound successfully clears these hurdles, the primary projection zone would be the descending daily 50-period EMA, currently at 66346.06. This moving average serves as a key structural benchmark for mean reversion. A more optimistic scenario could target the weekly R2 pivot at 68571.85. Confirmation of the rebound requires a sustained break and daily close above 62500. Conversely, a clear rejection from the current levels followed by a drop below 60000 would be a significant weakening signal, indicating that the bearish pressure, highlighted by the high daily ADX in the entry analysis, remains in control.

Breakout: Structural Catalyst Assessment
The Breakout framework is currently not plausible for BTC/USDC. This framework is designed to identify a structural rupture following a period of price compression and energy accumulation beneath a significant resistance level. The present market structure exhibits characteristics contrary to these prerequisites. The daily and weekly charts depict a clear downtrend, with price action concentrated in the lower portion of the recent range, near the low of 57744.87, rather than consolidating under a resistance ceiling such as the Donchian 20 upper at 67269.42 or the D1 EMA 50 at 66346.06. This downward trajectory is reinforced by bearish momentum indicators, including a D1 RSI of 37.26 and a W1 RSI of 32.89. Furthermore, the D1 ADX reading of 37.28 indicates a strong, active trend, which is inconsistent with the equilibrium or compression phase that typically precedes a breakout. For this framework to become relevant, a structural shift would be required, involving the cessation of the downtrend and the formation of a sustained consolidation base against a clearly defined horizontal resistance.

Bitcoin Bearish Continuation Analysis: Directional Flow Assessment
The technical structure for BTC/USDC presents a plausible scenario for a bearish continuation. The dominant feature is a well-defined downtrend on the daily chart, characterized by a sequence of lower highs and lower lows established throughout June. This directional flow is reinforced by the price's position far below key moving averages, such as the D1 EMA 50 at 66346.06, which acts as a dynamic resistance and confirms bearish market control. The weekly context provides further support for this reading, showing a multi-week decline with price having decisively broken below the W1 EMA 200 (69076.26). Momentum indicators are in alignment with this structure; the D1 ADX reading of 37.28 signals a strong, established trend, while the D1 RSI of 37.26 indicates that bears are in control. While a sharp counter-trend rally is visible on the H1 chart, pushing its RSI into overbought territory, this is currently interpreted as a corrective pullback within the broader downtrend rather than a structural reversal. The coherence between the D1 structure, W1 context, and momentum indicators supports the stability of the bearish directional flow.

Comparative Framework Verdict
In the current market structure for BTC/USDC, the Bearish Continuation framework emerges as the most plausible scenario. Its strength lies in the clear alignment of price action, trend, and momentum. The established downtrend on both daily and weekly timeframes, with price trading well below key moving averages, provides a strong directional bias. A daily ADX reading of 37.28 confirms the trend's power, making any short-term rallies appear corrective. For this framework to remain valid, the price must fail to reclaim the weekly pivot point around $61,039. The Range/Rebound framework is considered a borderline, secondary scenario. It correctly identifies the significance of the current support zone, anchored by the weekly Lower Bollinger Band and recent lows near $58,000. The bounce from this level, supported by oversold daily Stochastics, gives the rebound thesis some merit. However, attempting a counter-trend move in such a strong bearish environment is inherently risky, keeping this framework from being fully plausible. Finally, the Breakout framework is not plausible. The market is in a distinct trending phase, not a period of consolidation or compression below a well-defined resistance. The conditions required for an explosive breakout—such as contracting volatility and a sideways range—are absent. Therefore, attention remains on the conflict between the dominant bearish trend and the defense of critical weekly support.
For broader market context, readers can also review the latest related fundamental analysis for this pair.
For live market monitoring and the full interactive chart, readers can access the dedicated BTC Market Hub.
Disclaimer
CopyTradia provides technical analysis for informational and educational purposes only. This content does not constitute financial advice, investment recommendations, or trading signals. Cryptocurrency markets are highly volatile. Past performance is not indicative of future results. Always conduct your own research (DYOR) and consult a qualified financial advisor before making any investment decisions.


