Bitcoin 200-Week EMA Support: Price Breakdown Analysis
- CopyTradia Intelligence

- Jun 2
- 4 min read
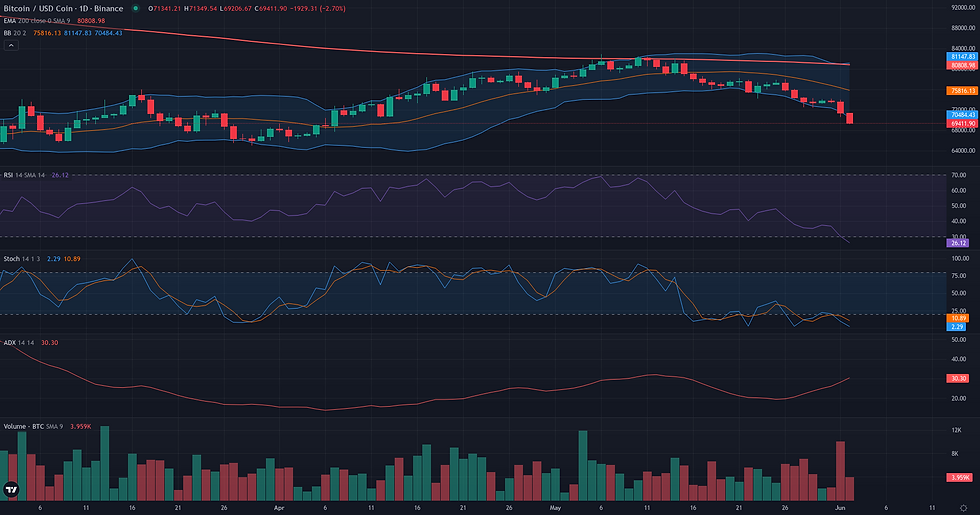
This Bitcoin 200-week EMA support examines the current BTC/USDC structure in the context of support defense and weakening alternative frameworks. BTC/USDC has experienced a significant bearish acceleration, with its price falling to 71,341.21 and breaking below the prior week's low. This sharp decline is underscored by a strengthening daily trend, as indicated by an ADX reading of 28.04, even as the daily RSI approaches oversold territory at 30.34. The price is now trading well below key daily moving averages, signaling a clear shift in control to sellers in the short-to-medium term. This technical breakdown occurs within a broader market context of price contraction and rebalancing, as described in the latest fundamental analysis, suggesting the market is testing key structural levels rather than acting on strong directional conviction. The immediate focus is now on a major long-term support confluence around the 200-week EMA near 69,233, a level that will likely define the market's next structural move.

Range & Rebound Resolution: Support and Friction Zones
The Range/Rebound framework, initially assessed as borderline, now faces a critical test as the market's bearish momentum has intensified. The validation zone, which required stabilization above 70600 USDC, has been breached on the 4-hour timeframe, indicating that sellers have pushed past the first line of defense. The entire viability of a technical rebound now hinges on a major weekly support confluence located around 69,250 USDC. This critical zone is anchored by the W1 EMA 200 (69,233.18) and the most recent 4H low. A failure to hold this level, marked by a daily close below it, would constitute the invalidation condition for this framework, suggesting a continuation of the corrective trend towards deeper supports like the D1 S2 pivot at 68,568.96. Should buyers manage to defend this weekly support, any recovery would encounter a series of friction zones. The first obstacle is the D1 S1 pivot at 69,955.08, followed by the broken 70,600 level. Confirmation of a rebound would require reclaiming these levels, signaling that selling pressure is being absorbed. Conversely, a weakening of the framework would be evident if the price fails to bounce decisively from the current support, instead consolidating below 70,000 USDC. If a strong rebound were to materialize, technical projection zones are located at the weekly pivot (74,685.93) and the daily EMA 50 (76,003.81).

Breakout: Structural Catalyst Assessment
The Breakout framework is currently not plausible for BTC/USDC. The market structure is exhibiting characteristics of a breakdown rather than the necessary pre-breakout compression. The recent price action saw a decisive drop below the previous week's low of 72,431.30, culminating in a close at 71,341.21. This move occurred on expanding volume and pushed the price below the lower D1 Bollinger Band (71,654.68), signaling an acceleration of the existing downtrend. Instead of coiling beneath a well-defined resistance, the price is falling away from key overhead levels such as the D1 EMA 50 (76,003.81) and the D1 EMA 200 (81,796.05). Momentum indicators corroborate this bearish view, with the D1 RSI at a weak 30.34, reflecting strong selling pressure, not the accumulation of buying interest. The weekly context provides no support for a bullish reversal, as the price remains firmly under its W1 EMA 50. For a breakout scenario to become relevant, a significant structural change would be required, including the establishment of a new consolidation range and a reclaim of key moving averages to neutralize the current bearish trend.

Bitcoin 200-week EMA Support: Directional Flow Assessment
The technical structure presents a borderline case for a bearish continuation. On one hand, the directional flow is clearly negative. The daily chart shows a decisive breakdown below recent support, with the price now trading significantly under key moving averages like the D1 EMA 50 (76003.81). The impulse of the last daily session was sharp and accompanied by rising volume, and the weekly context confirms this bearish bias. However, this strong downward momentum is now approaching a critical long-term support zone defined by the Weekly EMA 200 at 69233.18. The proximity to this major level, combined with short-term oversold readings on the D1 RSI (30.34), introduces a significant risk of a technical rebound or consolidation. The framework's plausibility is therefore conditional, hinging on the market's reaction to this key support. A failure to bounce decisively would strengthen the continuation case, while a strong defense of this level would challenge it.

Comparative Framework Verdict
Comparing the three technical frameworks, the market structure presents a conflict between strong immediate bearish momentum and the proximity of a major long-term support level. No single framework is dominant, but the Continuation and Range/Rebound scenarios outline the primary tension. The bearish Continuation framework is rated as borderline but is most aligned with the current price action. It correctly identifies the breakdown below recent supports and the strong negative momentum. However, its plausibility is tempered by the approach to the critical 200-week EMA support zone around 69,250 USDC, a level that could stall the trend. The Range/Rebound framework, also borderline, represents the alternative scenario. Its thesis is built on potential seller exhaustion, evidenced by oversold indicators, and a technical reaction from this major weekly support. Its immediate credibility is weakened, as its initial validation zone has already been breached, making any rebound attempt a more significant structural challenge. The Breakout framework is deemed not plausible, as the market is in a clear breakdown phase, the opposite of the required pre-breakout compression. The market's reaction to the 200-week EMA will be the deciding factor, either validating the continuation of the downtrend or providing the foundation for a difficult rebound.
For broader market context, readers can also review the latest related fundamental analysis for this pair.
For live market monitoring and the full interactive chart, readers can access the dedicated BTC Market Hub.
Disclaimer
CopyTradia provides technical analysis for informational and educational purposes only. This content does not constitute financial advice, investment recommendations, or trading signals. Cryptocurrency markets are highly volatile. Past performance is not indicative of future results. Always conduct your own research (DYOR) and consult a qualified financial advisor before making any investment decisions.


