AVAX Weekly Technical Analysis: Daily Range Battles Dominant Weekly Downtrend

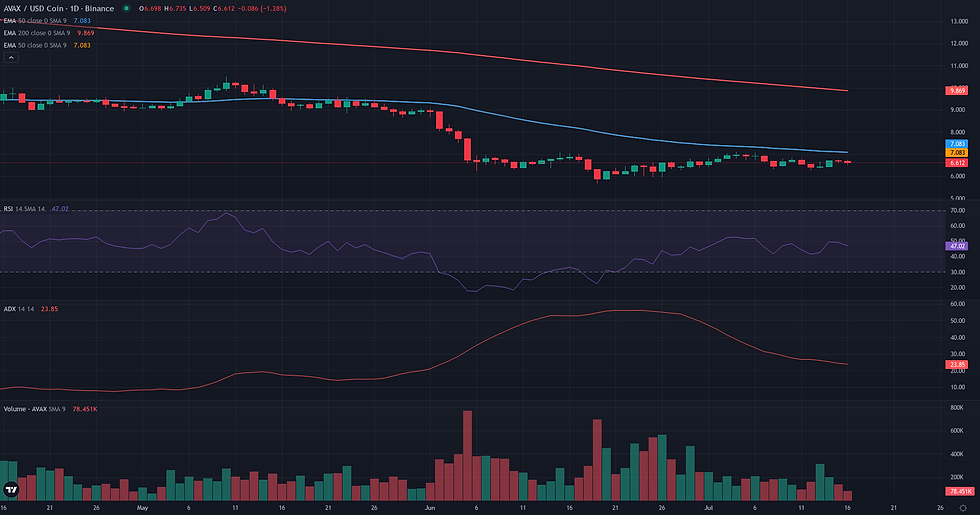
This AVAX weekly technical analysis examines the current AVAX/USDC structure in the context of support defense and weakening alternative frameworks. AVAX/USDC is currently defined by a technical stalemate, with price consolidating within a well-defined daily range. At a recent close of 6.70, the market shows clear signs of indecision, underscored by a non-trending D1 ADX of 24.38 and a neutral D1 RSI at 49.13. This period of stabilization, which has contained price action between approximately 6.36 and 7.11 for several weeks, suggests a temporary exhaustion of bearish momentum. However, this daily equilibrium exists under the shadow of a powerful weekly downtrend, confirmed by a high W1 ADX of 37.84 and price trading significantly below long-term moving averages. This technical conflict, where daily consolidation struggles against a dominant weekly trend, aligns with recent fundamental analysis highlighting a period of positioning adjustment and a struggle for autonomous momentum. The following analysis will explore the three technical frameworks—Range/Rebound, Breakout, and Continuation—that describe the potential resolutions to this structural tension.
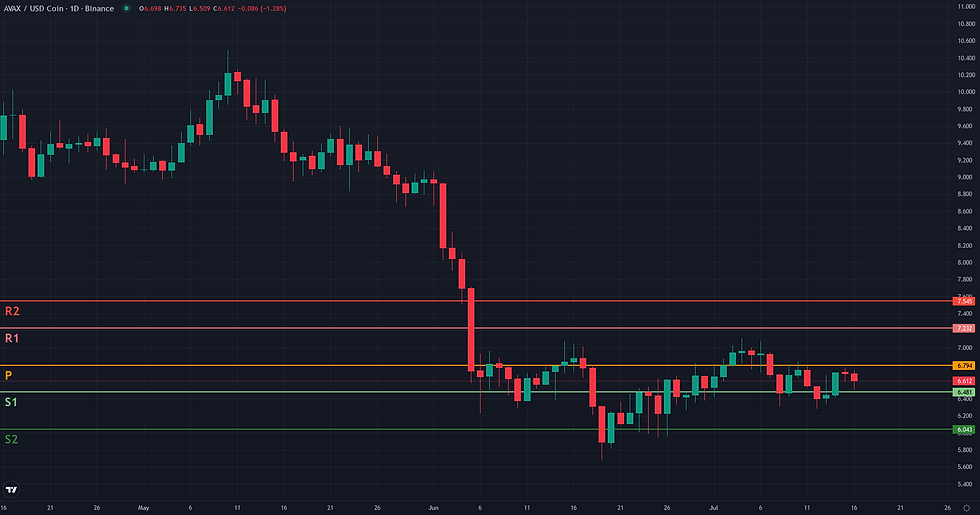
AVAX Weekly Technical Analysis: Technical Framework Assessment
The resolution for the AVAX/USDC Range/Rebound framework hinges on its ability to defend the lower boundary of its daily consolidation against persistent weekly bearish pressure. The validation zone, anchored between 5.95 and 6.20 USDC, represents the critical support area where a rebound must materialize. The framework would be structurally invalidated if the price breaks down with a daily close below the absolute range low of 5.68 USDC, which would signal a failure of the stabilization and a likely resumption of the macro downtrend. Before any significant upside can be considered, the price must navigate through several layers of technical friction. The first obstacle is the pivot cluster between 6.69 (D1 Pivot) and 6.79 (W1 Pivot), an area that has recently capped recovery attempts. Above this, the most significant barrier is the upper boundary of the range, a confluence of the D1 EMA 50 at 7.10 and the swing high at 7.11. A decisive break of this ceiling is required to confirm the rebound's strength. If the framework confirms and overcomes this friction, technical projections point towards the W1 R1 pivot at 7.23 USDC as a first reference, followed by the W1 R2 pivot at 7.55. Confirmation would involve reclaiming the pivot zone and breaking the D1 EMA 50. Conversely, the framework would show signs of weakening if it fails to hold recent 4H lows around 6.28, leading to a test of the validation zone under negative volume, which would challenge the rebound hypothesis without immediately invalidating it.
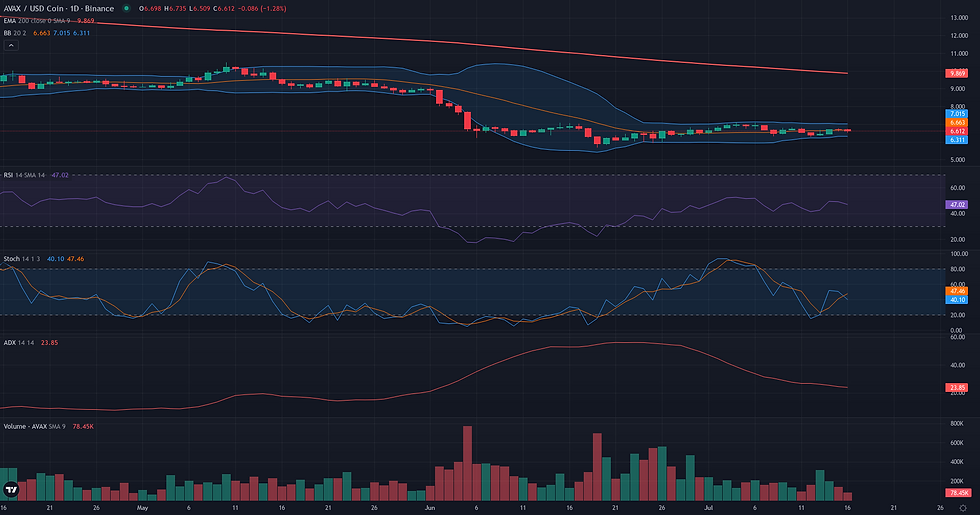
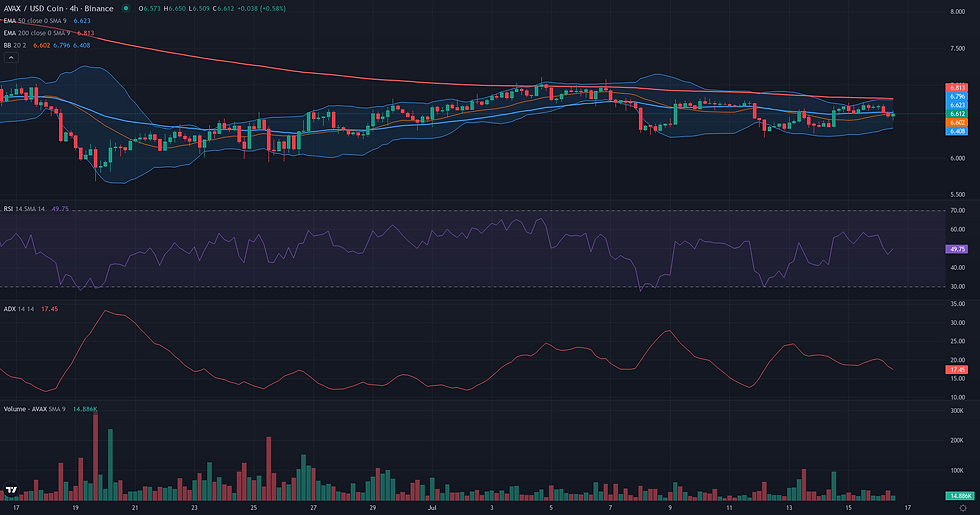
Breakout: Structural Catalyst Assessment
The Breakout framework for AVAX/USDC presents a borderline case, defined by a sharp contrast between a constructive daily chart and a prohibitive weekly context. On the daily timeframe, the structure is technically sound for a potential breakout. Price has been consolidating for over three weeks in a range, establishing a clear and respected resistance ceiling at $7.11, a level reinforced by the 20-day Donchian upper band. This compression phase is accompanied by classic preparatory signals: a notable decline in volume (Volume Oscillator D1 at -26.28%) and neutral momentum (RSI D1 at 49.13), suggesting a market coiling for its next move. However, this clean daily setup exists within a deeply bearish weekly structure. Price is trading far below key long-term averages like the W1 EMA50 ($13.41), and the weekly RSI (34.52) shows persistent weakness. This means any daily breakout attempt would be a counter-trend move against a powerful, established downtrend, making it highly susceptible to failure. The verdict is therefore borderline, acknowledging the valid D1 pattern while flagging the significant structural risk imposed by the higher timeframe.
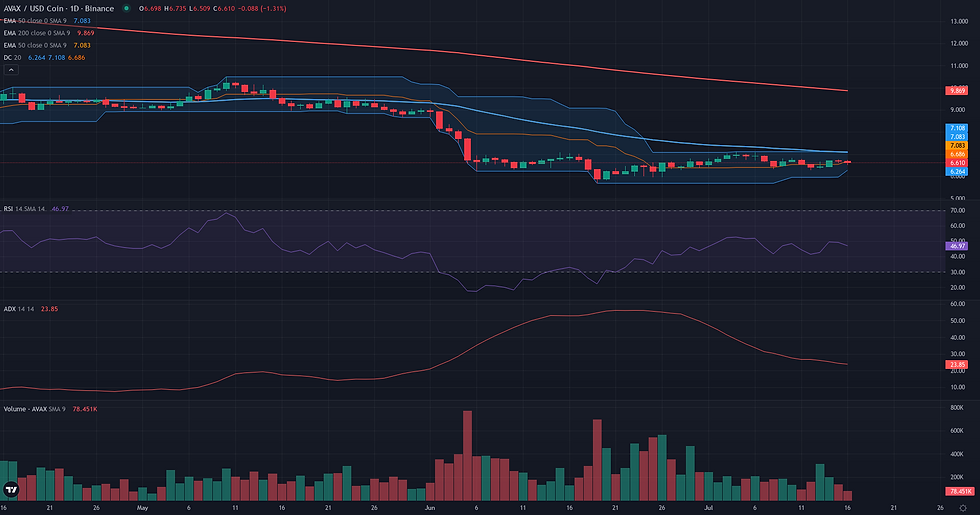
Continuation: Directional Flow Assessment
The Continuation framework is assessed as not plausible for AVAX/USDC at this time. The market structure lacks the primary characteristic of a 'Stable Directional Flow,' instead presenting a picture of consolidation and indecision. On the daily chart, a month-long recovery from the June lows has stalled at a critical resistance confluence formed by the D1 EMA 50 (7.10) and the recent weekly high (7.11). The price action since this rejection has been choppy and sideways, failing to establish a clear directional bias. This structural ambiguity is confirmed by key momentum indicators: the D1 ADX, at a subdued 24.38, points to a non-trending market, while the D1 RSI hovers neutrally at 49.13. Furthermore, the broader weekly context remains firmly bearish, with price trading significantly below its major moving averages, framing the recent daily rally as a counter-trend move. For the Continuation framework to become relevant, the market would first need to resolve its current state of equilibrium, either by decisively breaking and holding above the 7.11 resistance to signal bullish intent or by breaking below recent support around 6.28 to suggest a resumption of the larger downtrend.
Comparative Framework Verdict
Comparing the three technical frameworks for AVAX/USDC reveals a market in a state of clear conflict, with no single scenario holding a dominant technical edge. The Continuation framework is assessed as not plausible. Its core requirement for a stable directional flow is directly contradicted by the market's current state, which is characterized by a low D1 ADX (24.38) and neutral RSI, indicating a distinct lack of momentum. The primary tension lies between the two borderline frameworks: Range/Rebound and Breakout. Both scenarios accurately capture the current market structure—a daily consolidation range fighting against a strong weekly downtrend—but they propose opposite outcomes. The Range/Rebound framework focuses on the potential for price to defend the lower boundary of the range, specifically the support zone between 5.95 and 6.20, and bounce higher. Conversely, the Breakout framework anticipates a potential resolution to the upside through a decisive break of the 7.11 resistance ceiling. Both are rated borderline because any move is heavily conditioned by the opposing force of the macro trend. A rebound fights the downtrend, and a breakout would be a counter-trend move with a high risk of failure. Consequently, no framework is dominant; the market remains in a fragile equilibrium. The key element to monitor will be whether the daily range can absorb the persistent weekly selling pressure or if the macro trend reasserts itself, leading to a breakdown of the current consolidation structure.
For broader market context, readers can also review the latest related fundamental analysis for this pair.
For live market monitoring and the full interactive chart, readers can access the dedicated AVAX Market Hub.
Disclaimer
CopyTradia provides technical analysis for informational and educational purposes only. This content does not constitute financial advice, investment recommendations, or trading signals. Cryptocurrency markets are highly volatile. Past performance is not indicative of future results. Always conduct your own research (DYOR) and consult a qualified financial advisor before making any investment decisions.


