AVAX Weekly Range Rebound: Daily Consolidation Amidst Bearish Trend

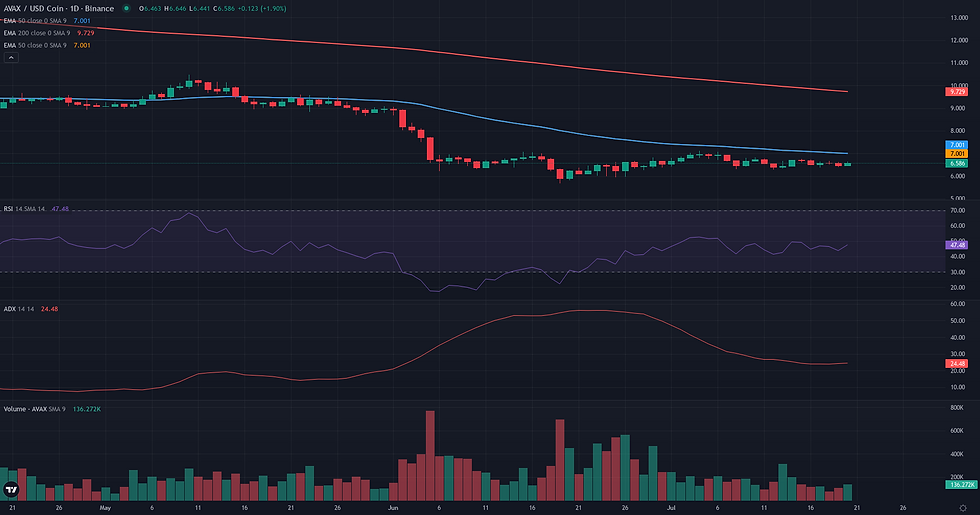
This AVAX weekly range rebound examines the current AVAX/USDC structure in the context of support defense and weakening alternative frameworks. AVAX/USDC is currently navigating a period of technical consolidation, with price action contained within a developing daily range. The daily close at 6.46 sits within a narrow weekly band, reflecting a market in equilibrium after a prolonged downtrend. This sideways movement is technically supported by a weakening directional trend, as indicated by the Daily ADX reading of 24.24, which has fallen below the 25 threshold. However, momentum remains subdued, with the Daily RSI at 43.78 failing to reclaim the neutral 50-level, suggesting that buying pressure is yet to build convincingly. Structurally, the price remains below significant resistance levels, including the D1 EMA 50 at 7.02, which caps the upper boundary of the current range. This technical consolidation aligns with recent market dynamics, which point to a period of significantly reduced volatility and lower activity rather than a market driven by a clear directional catalyst. The following analysis explores three potential frameworks—Range/Rebound, Breakout, and Continuation—to map the current market structure.
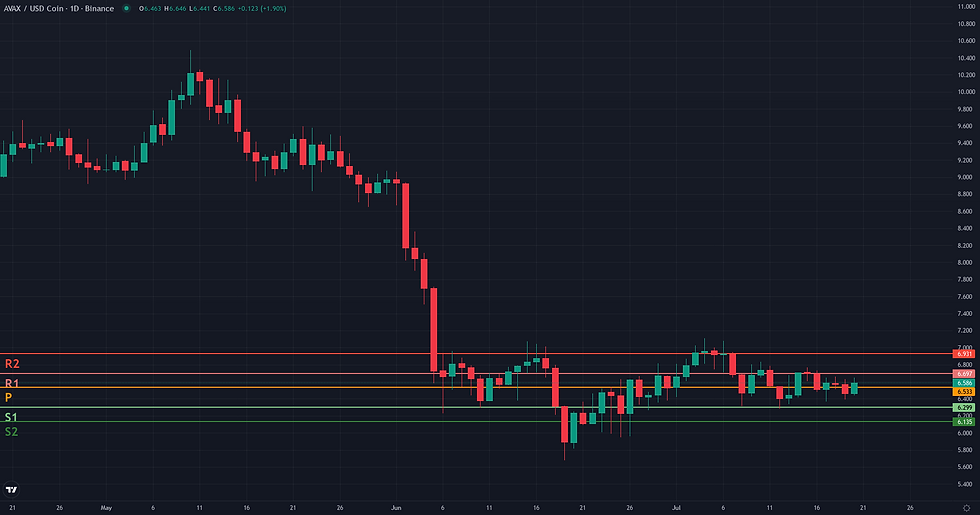
AVAX Weekly Range Rebound: Support and Friction Zones
Following the identification of a borderline Range/Rebound framework, the resolution analysis for AVAX/USDC focuses on the price action around the [6.66, 6.73] validation zone. This area, anchored by the D1 Bollinger Middle Band and 4H EMA 200, represents the immediate hurdle for any potential rebound within the established daily range. The framework would lose its structural integrity and be invalidated if the price breaks down with a daily close below the key support cluster around 6.30-6.40, specifically breaching the D1 S1 pivot at 6.36. Such a move would signal the failure of the range stabilization and a likely continuation of the dominant weekly downtrend. Should the price successfully validate the rebound by moving higher, it will face several friction zones. The first is the immediate resistance at 6.74-6.77, which includes the D1 R2 pivot and recent highs. A more formidable barrier is located between 6.93 (W1 R2) and 7.02 (D1 EMA 50), an area that has consistently capped previous rally attempts and defines the upper boundary of the range. The primary technical projection for a confirmed rebound is therefore this ceiling around 7.02. Confirmation of the rebound's strength would come from a sustained 4H close above 6.77, while a weakening of the attempt would be signaled by a rejection from within the validation zone, with price falling back below 6.60. The current 4H momentum (RSI at 55.70) provides some support for the rebound scenario, but the overarching bearish weekly trend necessitates a cautious and evidence-based reading of the resolution.
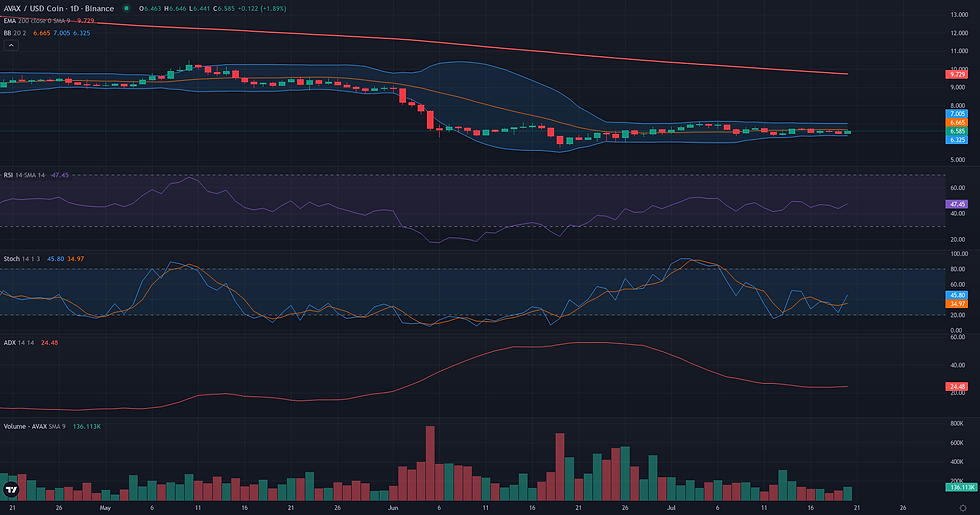
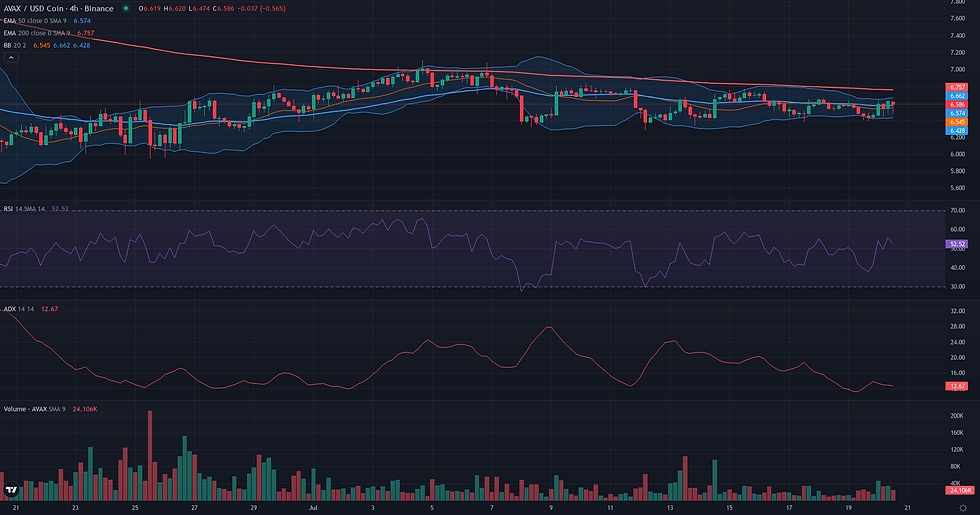
Breakout: Structural Catalyst Assessment
The Breakout framework is assessed as not plausible for AVAX/USDC at this time. The primary condition for a breakout—a period of price compression directly beneath a well-defined resistance level—is absent from the current daily structure. Instead of building pressure against the recent high of 7.11 (Donchian 20 D1 upper), the price is exhibiting weakness, trading in the lower portion of its recent range and below multiple technical resistance levels, including the 4H EMA 200 at 6.73 and the D1 middle Bollinger Band at 6.66. This lack of upward drive is corroborated by key indicators. The D1 RSI at 43.78 signals bearish momentum, while the Volume Oscillator's deeply negative reading of -35.78 highlights a significant lack of volume and market interest, which is antithetical to the energy required for a structural break. Furthermore, the weekly context provides a strong headwind; with price trading far below its major moving averages and a W1 RSI of 33.22, the higher-timeframe trend remains firmly bearish. For this framework to become relevant, the structure would need to fundamentally change, requiring price to first reclaim the 6.70-7.11 resistance zone with a demonstrable increase in volume and momentum.
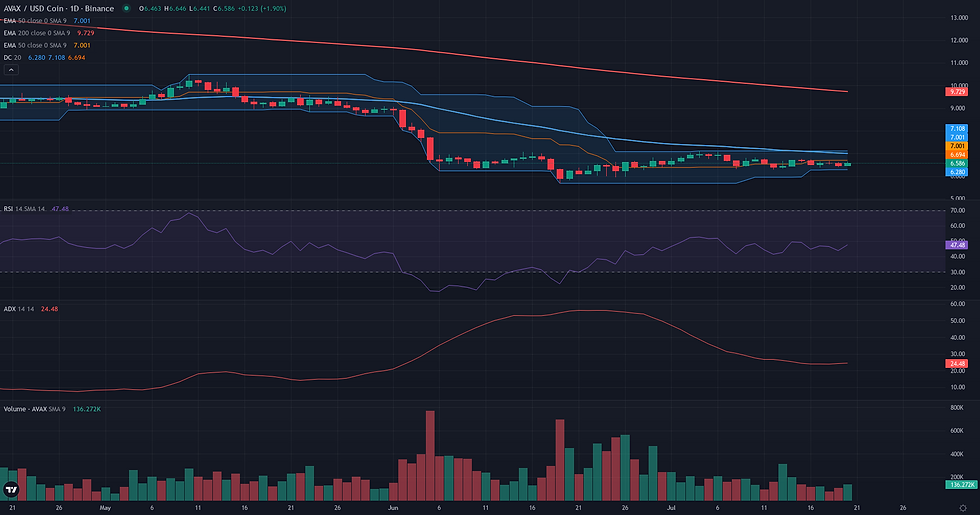
Continuation: Directional Flow Assessment
The bullish Continuation framework is not considered plausible for AVAX/USDC at this time due to a market structure that is fundamentally at odds with the required 'Stable Directional Flow'. The primary obstacle is the asset's position within a well-defined bearish context on both daily and weekly timeframes. Price is currently trading well below its key daily moving averages, including the D1 EMA 50 at 7.02, which often acts as a dynamic resistance in downtrends. This bearish posture is reinforced by the weekly chart, where the price remains significantly depressed relative to its major averages, confirming a long-term lack of bullish control. On a more tactical level, the daily momentum profile fails to support a continuation scenario. The D1 RSI at 43.78 indicates that bearish momentum prevails, while the D1 ADX at 24.24 suggests the absence of a strong, discernible trend, pointing more towards consolidation or drift than a directional impulse. For this framework to become relevant, the structure would need to see a material shift, starting with a convincing reclaim of the D1 EMA 50 and the formation of a clear higher-low sequence.
Comparative Framework Verdict
In this week's AVAX weekly technical analysis, the three strategic frameworks present a clear hierarchy of plausibility. The Range/Rebound framework emerges as the most relevant scenario, though it is assessed as 'borderline'. This reading captures the primary tension in the market: a visible consolidation on the daily chart, evidenced by a weakening trend and established support, clashing with a powerful, overarching bearish trend on the weekly timeframe. The resolution of this framework hinges on whether the price can reclaim the validation zone between 6.66 and 6.73, which would signal a successful rebound within the range. Conversely, both the bullish Breakout and Continuation frameworks are deemed 'not plausible'. The Breakout scenario fails due to a lack of necessary preconditions; specifically, the absence of price compression under a clear resistance level and a significant deficit in volume, indicating no build-up of buying pressure. Similarly, the Continuation framework is invalidated by the fundamentally bearish market structure. With price trading well below key daily and weekly moving averages and momentum indicators remaining in bearish territory, the conditions for a stable directional uptrend are simply not met. Therefore, the market's immediate future appears to be defined by the outcome of the current range, with a breakdown below support signaling a return to the dominant downtrend.
For broader market context, readers can also review the latest related fundamental analysis for this pair.
For live market monitoring and the full interactive chart, readers can access the dedicated AVAX Market Hub.
Disclaimer
CopyTradia provides technical analysis for informational and educational purposes only. This content does not constitute financial advice, investment recommendations, or trading signals. Cryptocurrency markets are highly volatile. Past performance is not indicative of future results. Always conduct your own research (DYOR) and consult a qualified financial advisor before making any investment decisions.


