AVAX Weekly Continuation Analysis: Trend Pauses at Key Levels

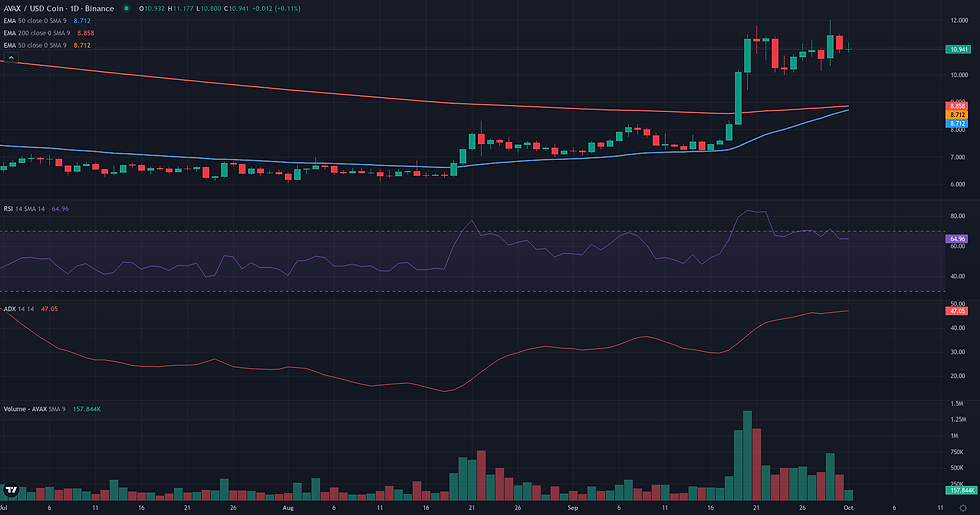
This AVAX weekly continuation analysis examines the current AVAX/USDC structure in the context of support defense and weakening alternative frameworks. AVAX/USDC is currently navigating a period of high-momentum consolidation following a powerful uptrend. The daily chart reveals a strong underlying trend, evidenced by an ADX reading of 43.26, with bullish momentum confirmed by a daily RSI of 64.90. Price action has been confined within a clear range over the past week, oscillating between the 9.98 support and the 11.79 resistance. While the price remains comfortably above its key daily moving averages, it is contending with overhead resistance from the weekly EMA 50 near 11.41. This technical consolidation aligns with recent fundamental observations of a market in re-evaluation, where a reduction in speculative derivatives exposure suggests a pause for conviction after a strong monthly rally. The current structure presents a classic scenario of a trend pausing to gather strength, with the boundaries of the recent range now serving as critical technical markers for the market's next directional move.

Range & Rebound Resolution: Support and Friction Zones
The resolution for this borderline Range/Rebound framework for AVAX/USDC is anchored to the validation zone of 9.98-9.99 USDC, which marks the low of the current daily consolidation range and aligns with the weekly S1 pivot. The framework's coherence hinges on the market's ability to defend this support. The invalidation zone for this rebound thesis is a structural failure of this range. A daily close below 9.98 USDC would break the consolidation pattern and suggest that the strong underlying uptrend, previously flagged by a high D1 ADX, is failing or reversing, thus negating the rebound scenario. Between the validation zone and a full confirmation, several friction zones exist. The price is currently navigating an immediate hurdle around the weekly pivot at 10.89. The most significant obstacle, however, is the top of the range, a dense resistance cluster formed by the recent D1 high at 11.79, the weekly R1 pivot at 11.81, and the weekly EMA 50 at 11.41. This area represents the primary test for buyers. If the rebound gains traction and overcomes this friction, the primary projection zone is this same 11.79-11.81 resistance cluster. A decisive breakout above this ceiling would shift the narrative from a range rebound to a potential trend continuation, bringing the weekly R2 pivot at 12.71 into focus as a secondary projection. Confirmation of the rebound requires holding above the 10.89 pivot, while a rejection and return to the 9.98 low would serve as a significant weakening condition.


Breakout: Structural Catalyst Assessment
The Breakout framework appears plausible for AVAX/USDC, centered on a well-defined daily structure. Following a powerful impulse that peaked at 12.00, the price has entered a consolidation phase directly beneath this resistance. This pattern of thrust and compression is characteristic of a market preparing for a potential continuation. The key resistance area is technically significant, marked by the recent high, the Donchian 20 D1 upper band at 12.00, and the weekly R1 pivot at 11.81. Supporting this structural reading, momentum indicators are robust; the D1 ADX at 43.26 signals a very strong existing trend, while the D1 RSI at 64.90 indicates bullish strength without being overextended. The primary limiting factor is found on the weekly timeframe, where the EMA 50 W1 at 11.41 introduces a major point of potential friction within the breakout zone. While this weekly moving average represents a formidable hurdle, its presence reinforces the importance of the 12.00 level rather than invalidating the breakout thesis. A successful break would need to clear this confluence of resistance, but the underlying daily structure and momentum suggest such an attempt is technically coherent.

AVAX Weekly Continuation Analysis: Directional Flow Assessment
The Continuation framework appears technically plausible, anchored in a powerful and well-defined daily uptrend. A recent explosive impulse wave, confirmed by a high ADX reading of 43.26, established a clear directional flow. The subsequent price action has formed an orderly pullback, consolidating above the key support zone of 9.98-9.99, which aligns with the weekly S1 pivot. This consolidation on decreasing volume is characteristic of a healthy pause within a trend, rather than a reversal. Momentum indicators remain firmly in bullish territory on both daily (RSI 64.90) and weekly (RSI 60.09) timeframes, suggesting underlying strength. The primary limiting factor is the proximity of the weekly EMA 50 at 11.41, which acted as resistance at the peak of the recent impulse. While this level represents a significant structural hurdle, the dominant strength of the daily trend structure suggests that a re-test and potential continuation is the more probable scenario.
Comparative Framework Verdict
In comparing the three strategic frameworks, two distinct narratives emerge, with one showing greater alignment with the prevailing market dynamics. The Continuation and Breakout frameworks are both rated as plausible, as they correctly interpret the current consolidation as a pause within a powerful, established uptrend. The Continuation framework is considered dominant because its thesis of an orderly pullback holding key support around 9.98-9.99 accurately describes the immediate market structure. This view is strongly supported by a high ADX and robust RSI, which signal trend strength rather than exhaustion. The Breakout framework serves as a plausible secondary scenario, representing the logical next phase if the continuation thesis holds. It focuses on the potential for price to resolve the consolidation upwards by clearing the significant resistance cluster around 12.00. Conversely, the Range/Rebound framework is the weakest of the three, rated as borderline. While it correctly identifies the 9.98-11.79 price range, its core assumption of a non-trending, rebalancing market is directly contradicted by the high-momentum readings. This makes the scenario of a simple rebound less probable than a trend-driven resolution. The market's direction will likely be clarified by its reaction to the support at 9.98 and the resistance at 12.00.
For broader market context, readers can also review the latest related fundamental analysis for this pair.
For live market monitoring and the full interactive chart, readers can access the dedicated AVAX Market Hub.
Disclaimer
CopyTradia provides technical analysis for informational and educational purposes only. This content does not constitute financial advice, investment recommendations, or trading signals. Cryptocurrency markets are highly volatile. Past performance is not indicative of future results. Always conduct your own research (DYOR) and consult a qualified financial advisor before making any investment decisions.


