AVAX Technical Analysis: Range Consolidation Holds Firm Against Weekly Downtrend

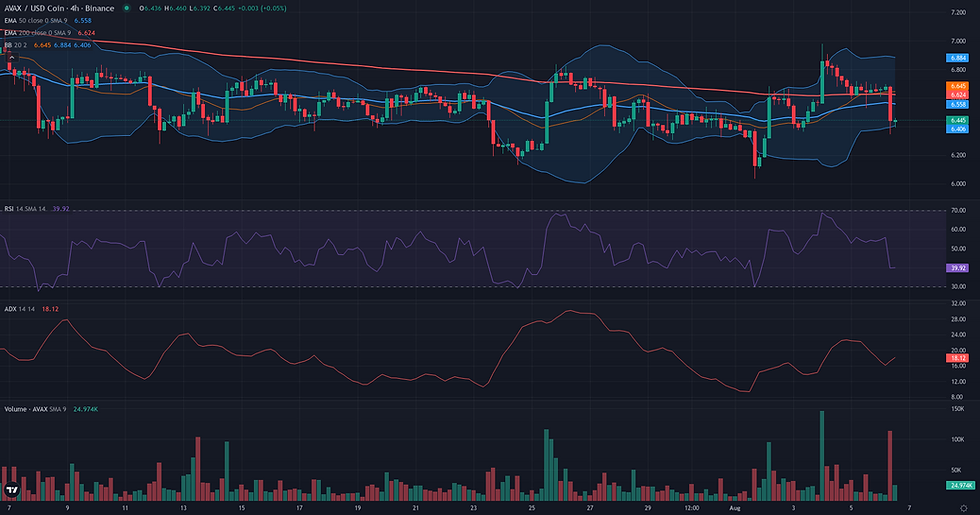
This AVAX technical analysis examines the current AVAX/USDC structure in the context of support defense and weakening alternative frameworks. AVAX/USDC is currently navigating a period of technical consolidation, with price action largely contained within its recent weekly range of 6.04 to 6.75. The daily chart reflects a market in equilibrium, characterized by a neutral RSI of 52.48 and a low ADX of 20.43, confirming the absence of a directional trend. This price compression is occurring below key moving averages, including the 50-day EMA at 6.77, which is acting as immediate resistance. This technical consolidation aligns with the latest fundamental analysis, which highlights a period of subdued volatility and price contraction amidst a broader market sentiment of fear. However, this daily sideways movement must be contextualized within a powerful weekly downtrend, where a high ADX of 38.95 signals that long-term bearish pressure remains the dominant force. This conflict between the stable daily range and the bearish weekly trend defines the current strategic landscape.

AVAX Technical Analysis: Technical Framework Assessment
The resolution for the AVAX/USDC Range/Rebound framework hinges on the defense of its established daily range against a powerful weekly downtrend. Starting from the validation zone of [6.04, 6.21], which marks the structural floor, the framework's coherence is now being tested after a rejection from the range highs. The primary invalidation condition for this rebound scenario would be a daily close below the 6.04 USDC swing low. Such a breakdown would shatter the range structure and signal a probable continuation of the macro bearish trend. For the rebound to confirm, the price must navigate through several layers of technical friction. The most immediate obstacle is the resistance cluster formed by the daily 50-period EMA at 6.77 USDC and the weekly R1 pivot at 6.85 USDC. This area has historically capped upside attempts. Beyond this, the absolute ceiling of the range at the 6.98 USDC high represents the final hurdle. A successful and confirmed rebound would have this upper range boundary as its primary projection zone. If bullish momentum is strong enough to break this ceiling, the next structural reference point lies at the weekly R2 pivot of 7.15 USDC. Currently, the framework shows signs of weakening, with the price having fallen to test the weekly pivot at 6.44 USDC. A failure to hold this level would be a significant warning, likely prompting a re-test of the validation zone and casting doubt on the rebound's viability.

Breakout: Structural Catalyst Assessment
The Breakout framework for AVAX/USDC presents a borderline case, characterized by a clear structural opportunity facing significant dynamic and contextual headwinds. On the daily chart, a horizontal resistance zone has been clearly defined between approximately 6.85 (W1 R1 Pivot) and the recent high of 6.98 (Donchian 20 D1). Price has tested this ceiling on several occasions over the past month, forming a potential consolidation base that makes a breakout scenario structurally conceivable. However, the preparation for such a move appears weak. The daily ADX, at a low 20.43, signals a distinct lack of directional trend, while the most recent push to 6.98 was met with the highest volume in 30 days and a rejection, hinting at the presence of supply. The primary limiting factor is the weekly context, which remains overtly bearish. With the weekly RSI at 34.44 and the weekly ADX at a strong 38.95, any daily breakout would be a counter-trend move against a powerful, established downtrend. This tension between the readable D1 resistance and the unsupportive underlying dynamics places the framework in a borderline state, pending a decisive resolution with stronger momentum.

Continuation: Directional Flow Assessment
The Continuation framework is currently not plausible for AVAX/USDC. The analysis reveals a market structure that lacks the primary characteristic required for this strategy: a stable and coherent directional trend. On the daily timeframe, price action over the past month has been defined by volatile oscillations within a range, rather than a clear progression. This lack of direction is quantitatively confirmed by the D1 ADX, which stands at a low 20.43, signaling a non-trending or weak-trending environment. Furthermore, the broader weekly context presents a significant headwind. The price is trading substantially below key long-term moving averages like the D1 EMA200 (9.15) and W1 EMA50 (12.40), embedding the current price action within a dominant bearish structure. The high weekly ADX of 38.95 indicates that this underlying downtrend remains strong. Therefore, any attempt at a bullish continuation on the daily chart would be a counter-trend move against a powerful, higher-timeframe flow, which is inconsistent with the framework's objective. For the Continuation framework to become relevant, the market would first need to exit its current ranging state and establish a new, clear directional impulse. This would require a sustained break above recent resistance levels, such as the 6.98 high, and a corresponding increase in the D1 ADX to levels above 25, indicating the emergence of a genuine trend.

Comparative Framework Verdict
In this week's AVAX technical analysis, the market structure presents a clear conflict between different timeframes, resulting in no single framework achieving dominant plausibility. The Continuation framework is assessed as 'not_plausible' due to the definitive lack of a directional trend on the daily chart, evidenced by a low ADX reading of 20.43. The current price action is a range, not a stable trend suitable for continuation. Both the Range/Rebound and Breakout frameworks are rated 'borderline', as they represent two potential but opposing outcomes of the current consolidation. The Range/Rebound scenario is grounded in the well-defined support near 6.04, but is weakened by the strong underlying weekly downtrend that makes any rebound a counter-trend move. Conversely, the Breakout framework identifies a clear resistance ceiling at 6.98, but lacks the necessary momentum and dynamic preparation for a convincing upward thrust. Both scenarios are constrained by the same powerful weekly bearish context, which acts as a significant headwind. Ultimately, the market is in a state of compression. The resolution will depend on which boundary of the daily range gives way first. A decisive break below the 6.04 support would invalidate the rebound and align with the macro downtrend, while a sustained move above 6.98 would be required to lend any credibility to a bullish breakout.
For broader market context, readers can also review the latest related fundamental analysis for this pair.
For live market monitoring and the full interactive chart, readers can access the dedicated AVAX Market Hub.
Disclaimer
CopyTradia provides technical analysis for informational and educational purposes only. This content does not constitute financial advice, investment recommendations, or trading signals. Cryptocurrency markets are highly volatile. Past performance is not indicative of future results. Always conduct your own research (DYOR) and consult a qualified financial advisor before making any investment decisions.


