AVAX Range Rebound Analysis: Price Stabilizes on Key Support

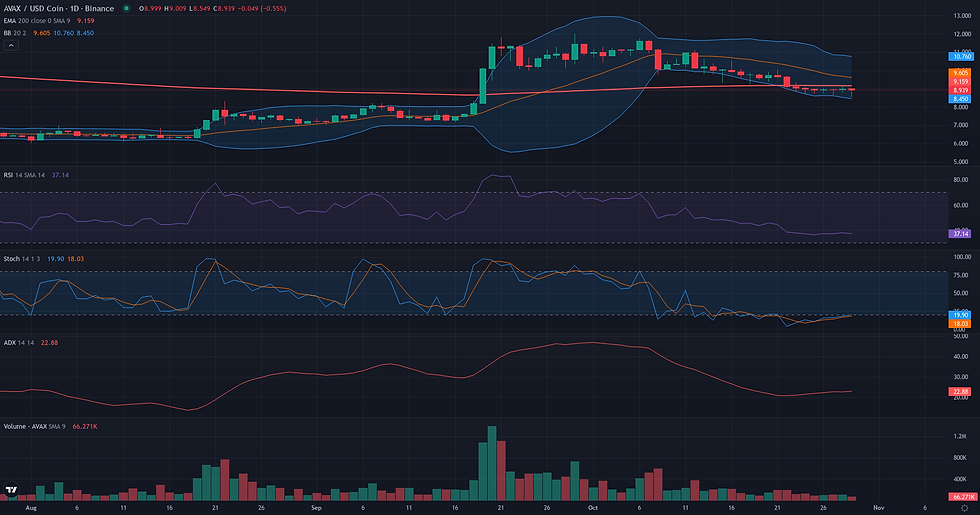
This AVAX range rebound analysis examines the current AVAX/USDC structure in the context of support defense and weakening alternative frameworks. AVAX/USDC has entered a phase of consolidation after a significant downtrend, with the price currently hovering around the $9.00 level. The market structure is caught in a technical bind, defined by the D1 EMA 50 acting as resistance at $9.42 and the crucial D1 EMA 200 providing support at $8.84. This price compression reflects a broader state of indecision. Momentum indicators are weak, with the daily RSI at 37.86 suggesting a lack of buying pressure, while the ADX at 22.55 confirms the absence of a strong directional trend. This technical picture of trend exhaustion aligns with the broader market context, where cooling sentiment and notable deleveraging have removed strong directional catalysts. The current stabilization sets the stage for conflicting scenarios, where the market must either confirm a bottom or resume its prior bearish trajectory. This analysis will explore three distinct technical frameworks—Range/Rebound, Breakout, and Continuation—to map out these potential paths based on current structural evidence.

AVAX Range Rebound Analysis: Support and Friction Zones
The range rebound framework for AVAX/USDC is currently being tested within its validation zone of 8.37 - 8.84. This area, defined by the D1 EMA 200 and the W1 S1 pivot, is acting as the primary battleground between buyers and sellers. For the rebound scenario to maintain its coherence, this support structure must hold. The invalidation of this framework would be a clear structural failure. A daily close below the W1 S1 pivot at 8.37 would signal that sellers have absorbed the demand in this zone, breaking the market's stabilization and opening the door for further downside. Before any significant recovery, the price must navigate several layers of resistance. The first friction zone lies at the D1 pivot of 8.98, which has already capped recent recovery attempts on the 4H chart. A more formidable challenge awaits at the W1 pivot (9.21) and the D1 EMA 50 (9.42). Overcoming the D1 EMA 50 would be a key confirmation that the market structure is shifting in favor of buyers. If the rebound successfully materializes, the first technical projection zone is the W1 R1 pivot at 9.75. A sustained rally could extend towards a more significant resistance cluster formed by the W1 R2 pivot at 10.59 and the major W1 EMA 50 at 11.10. Conversely, the framework will show signs of weakening if price repeatedly fails to break above the 8.98 resistance or starts spending significant time below the 8.37 pivot, even without a daily close, suggesting that the buying pressure is insufficient to sustain a recovery.

Breakout: Structural Catalyst Assessment
The Breakout framework is currently not plausible for AVAX/USDC. A valid breakout scenario typically requires a period of price compression directly beneath a well-defined resistance level, coupled with building momentum. The current market structure presents the opposite picture. Since peaking at 12.00 in late September, the price has entered a distinct daily downtrend, characterized by a series of lower highs and lower lows. The recent price action is a tight consolidation, but it is occurring near the recent lows around 9.00, rather than preparing an assault on resistance. Key moving averages, such as the D1 EMA50 at 9.42 and the W1 EMA50 at 11.10, are positioned well above the current price, acting as significant overhead resistance. Furthermore, momentum indicators reflect a lack of buying interest; the D1 RSI is weak at 37.86, and the Volume Oscillator's negative value of -37.55 highlights diminishing participation. For this framework to become relevant, a major structural change would be necessary, involving a sustained move back above the 9.75-10.00 area and a subsequent period of consolidation that demonstrates a clear accumulation of bullish pressure.

Continuation: Directional Flow Assessment
The Continuation framework is not technically plausible in the current market structure for AVAX/USDC. The primary condition for this framework, a 'Stable Directional Flow,' is absent. While the market recently experienced a strong bullish impulse in September, this move was decisively rejected, and the price has since entered a clear downtrend from the 12.00 high. However, this new bearish trend cannot be considered stable for a continuation reading either, as it has now collided with a significant long-term support level: the daily EMA 200, currently at 8.84. The price action of the last week shows a stall and consolidation around this level, with lows testing just below it. This price behavior, combined with weak momentum indicators like the D1 RSI (37.86) and a low ADX (22.55), suggests trend exhaustion and indecision rather than directional conviction. The weekly context reinforces this reading, showing the September rally failed at the W1 EMA50, placing the asset in a broader bearish context. Therefore, the market is currently in a state of structural conflict, caught between short-term bearish pressure and long-term support, making a continuation scenario in either direction unreadable and unreliable at this time.

Comparative Framework Verdict
Comparing the three strategic frameworks, the Range/Rebound scenario emerges as the only plausible interpretation of the current market structure for AVAX/USDC. This framework is supported by compelling evidence of seller exhaustion and price stabilization at a critical long-term support level. The validation for this rebound thesis is anchored in a zone between $8.37 and $8.84, which includes the daily EMA 200. Supporting factors such as oversold stochastics showing a bullish cross and a significant drop in selling volume lend strong coherence to the idea of a potential controlled reversal from this area. In stark contrast, both the Breakout and Continuation frameworks were deemed not plausible. The market currently lacks the necessary conditions for either scenario. A Breakout is invalidated by the absence of price compression under a clear resistance; instead, the consolidation is occurring at recent lows. Similarly, the Continuation framework fails because the market has lost its 'Stable Directional Flow.' The recent downtrend has stalled decisively at the D1 EMA 200, creating a structural conflict rather than an environment ripe for a sustained move in either direction. The weak momentum and low trend strength further undermine both of these directional theses. Moving forward, the key element to monitor is the market's reaction to the support zone defined by the Range/Rebound framework. A successful defense of this area could confirm a structural low, whereas a definitive break below it would invalidate the rebound potential and suggest a resumption of the prior downtrend.
For broader market context, readers can also review the latest related fundamental analysis for this pair.
For live market monitoring and the full interactive chart, readers can access the dedicated AVAX Market Hub.
Disclaimer
CopyTradia provides technical analysis for informational and educational purposes only. This content does not constitute financial advice, investment recommendations, or trading signals. Cryptocurrency markets are highly volatile. Past performance is not indicative of future results. Always conduct your own research (DYOR) and consult a qualified financial advisor before making any investment decisions.


