AVAX Daily Momentum Analysis: Challenging Major Resistance

This AVAX daily momentum analysis examines the current AVAX/USDC structure in the context of support defense and weakening alternative frameworks. AVAX/USDC has undergone a significant shift in character, breaking out of a prolonged consolidation phase with a powerful bullish impulse. Over the past week, the price has surged from a low of $6.23 to a high of $8.32, closing the daily session at $7.61. This move is supported by strong short-term momentum, with the D1 RSI reaching 68.44, and a rising ADX at 24.42 indicates a strengthening trend. The price is now trading firmly above its 50-day EMA ($6.76), a classic sign of a short-term trend reversal. This sharp technical rally aligns with fundamental observations of expanding leveraged participation and elevated volatility, suggesting the current market structure is driven by active positioning. However, this bullish daily structure is now directly challenging a zone of significant long-term resistance, most notably the 200-day EMA at $8.66, creating a critical decision point for the market.

AVAX Daily Momentum Analysis: Technical Framework Assessment
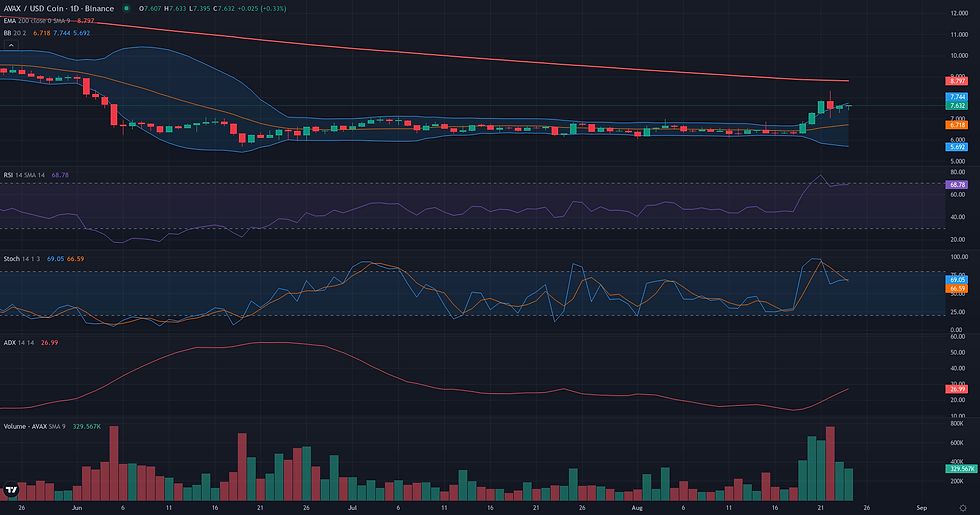
The Range/Rebound framework is assessed as not plausible for AVAX/USDC at this time. While the weekly chart reveals a broad consolidation range established since June, the daily price action has decisively shifted from stabilization to a strong bullish impulse. The framework seeks a controlled rebound from a support level, but current conditions show the opposite: a powerful 5-day rally that has propelled the price from the lower part of the range (~6.30) to a high of 8.32. This move is technically confirmed by price closing at the D1 Upper Bollinger Band (7.61) and a high D1 RSI of 68.44, both signaling significant upward extension rather than the beginning of a recovery. The high Volume Oscillator (58.98) further validates the strength of this recent trend. Consequently, the market structure does not align with the 'Controlled Reversal' signature. For this framework to become relevant, the market would first need to see a price correction and the subsequent formation of a clear support base, likely back within the prior consolidation zone, for instance around the W1 S1 pivot at 6.45.
Breakout: Structural Catalyst Assessment
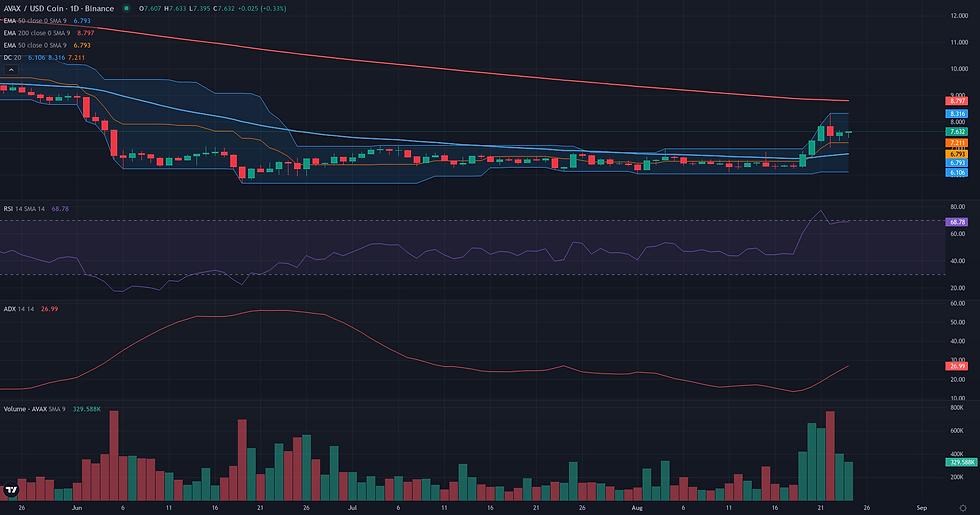
The technical structure for AVAX/USDC presents a compelling but conflicted breakout scenario, leading to a borderline assessment. The primary supportive element is the recent price action on the daily chart. After a month-long consolidation phase, the price has initiated a powerful upward impulse, breaking through previous range resistance. This move is validated by a significant increase in market participation, as shown by a high Volume Oscillator (58.98), and is backed by strong bullish momentum with the D1 RSI at 68.44. This sequence has established a clear potential breakout level at the recent peak of 8.32, which also corresponds to the weekly high. However, this bullish D1 setup faces immediate and substantial headwinds that temper its plausibility. The primary limiting factor is the proximity of major long-term resistance. The D1 EMA 200, a significant technical ceiling, is situated at 8.66, offering very little room for a clean follow-through post-breakout. Furthermore, the weekly chart context remains structurally bearish, with price trading far below key moving averages like the W1 EMA 50 (11.77). This higher-timeframe weakness suggests the current D1 rally is a counter-trend move, making it inherently more fragile. The tension between the explosive daily dynamic and the heavy overhead resistance is the core reason for the borderline verdict.
Continuation: Directional Flow Assessment
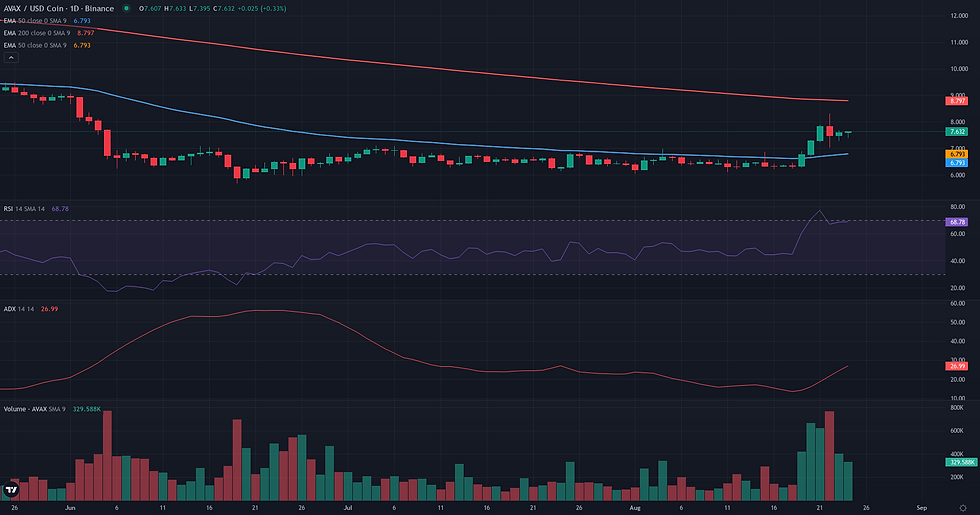
The technical structure for a bullish continuation is currently at a decision point, leading to a borderline assessment. On one hand, the recent market action displays a powerful directional impulse. A breakout from a multi-week consolidation range occurred with significant volume (D1 Volume Oscillator at 58.98) and pushed the D1 RSI to a strong 68.44, indicating robust momentum. Price has decisively cleared the D1 EMA50 at 6.76 and the H1 micro-structure suggests the subsequent pullback is a consolidation rather than a reversal. However, this bullish momentum faces considerable headwinds. The advance was sharply rejected near the 8.32 weekly high, a level just below the major D1 EMA200 resistance at 8.66. This rejection suggests the presence of significant supply. Furthermore, this entire daily move is unfolding within a broader weekly bearish context, where price remains far below key long-term moving averages. The resulting tension between the strong daily impulse and the formidable overhead resistance prevents a clean 'plausible' reading, making the current structure a test of the breakout's resilience.
Comparative Framework Verdict
The current technical landscape for AVAX/USDC presents a conflicted but clear picture, with no single framework emerging as dominant. Both the Breakout and Continuation frameworks are rated as 'borderline' because they capture two sides of the same core tension: a powerful daily bullish impulse running into significant overhead resistance. The Breakout scenario focuses on a potential move above the recent high of $8.32, a level that would signal a continuation of the aggressive buying pressure. Conversely, the Continuation framework identifies the support zone between $7.03 and $7.39 as the critical area that must hold to maintain the bullish structure after the initial surge. Both scenarios are tempered by the close proximity of the 200-day EMA at $8.66, a major long-term resistance level that could cap the rally. In contrast, the Range/Rebound framework is deemed 'not plausible'. The market is not stabilizing at a support level in preparation for a bounce; it has already executed a strong rally from the bottom of its prior range and is now exhibiting characteristics of trend extension, not reversal from a low. The decisive factor for the market's next directional move will likely be the interaction between the strong daily momentum and the formidable resistance just ahead.
For broader market context, readers can also review the latest related fundamental analysis for this pair.
For live market monitoring and the full interactive chart, readers can access the dedicated AVAX Market Hub.
Disclaimer
CopyTradia provides technical analysis for informational and educational purposes only. This content does not constitute financial advice, investment recommendations, or trading signals. Cryptocurrency markets are highly volatile. Past performance is not indicative of future results. Always conduct your own research (DYOR) and consult a qualified financial advisor before making any investment decisions.


