AVAX Continuation Technical Analysis: Bullish Pause

This AVAX continuation technical analysis examines the current AVAX/USDC structure in the context of support defense and weakening alternative frameworks. AVAX/USDC has entered a period of consolidation after a powerful bullish impulse was met with significant resistance. The price surged from below $8.00 to a weekly high of $11.48 before pulling back to a recent daily close of $10.27. This price action is underpinned by a strong directional trend, confirmed by a high D1 ADX reading of 39.57, while the D1 RSI at 67.18 indicates robust but potentially maturing momentum. The market is currently navigating the aftermath of a rejection from the key weekly 50-period EMA, a long-term structural barrier. This technical setup, a powerful impulse meeting significant resistance, aligns with recent fundamental observations of an internally-driven rally characterized by a surge in open interest and heightened volatility. The current structure presents a critical test of whether the recent rally was a sustainable breakout or a temporary surge.

Range & Rebound: Market Structure Assessment
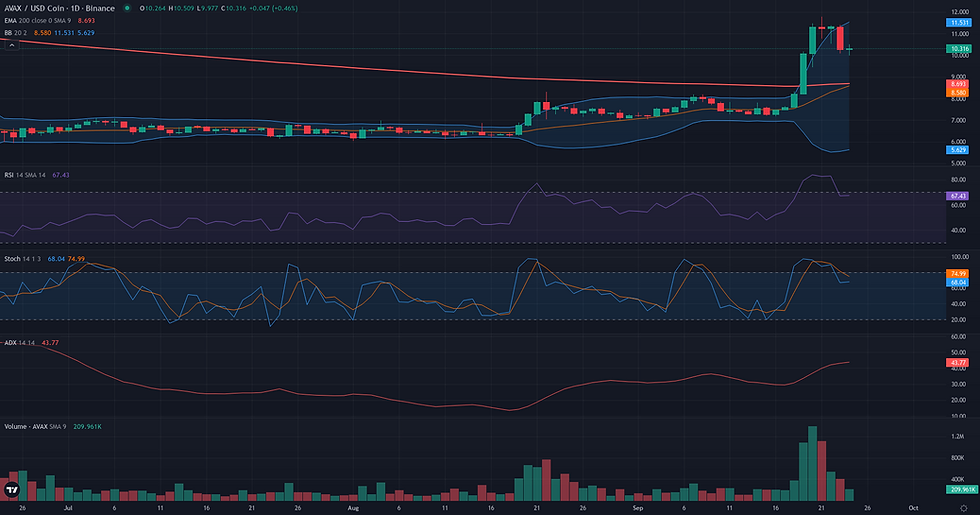
The Range/Rebound framework is not technically plausible for AVAX/USDC at this time. The market structure is defined by a powerful bullish breakout, a condition fundamentally at odds with the framework's search for stabilization or a controlled rebound from a support zone. Recent price action saw a surge from the $7.50 area to a high above $11.40, decisively breaking a multi-month consolidation. This impulsive move is confirmed by a high D1 ADX reading of 39.57, which signals a strong trending environment, not a range. On the weekly timeframe, the breakout is even more pronounced, with price closing the last full week at $11.31 after piercing its upper Bollinger Band at $10.56, a classic sign of trend acceleration. For the Range/Rebound framework to become relevant, the market would first need to exhaust its current upward momentum and undergo a significant retracement, followed by the formation of a new, readable support structure, for instance, around the former resistance and current D1 EMA 200 level of $8.35.
Breakout: Structural Catalyst Assessment
The Breakout framework is currently not plausible for AVAX/USDC. The market has recently experienced a powerful bullish impulse, culminating in a sharp rejection from a significant weekly resistance zone. Specifically, the price rally was halted precisely at the confluence of the W1 EMA 50 (11.43) and the recent weekly high (11.48). Instead of consolidating beneath this ceiling to prepare for a breakout, the price has entered a corrective pullback, with the last daily close at 10.27. This structure contradicts the core requirement of the framework, which seeks a compression of price and volatility just below a key level before a potential rupture. While the underlying trend shows strength, with a D1 ADX at 39.57 and strong volume on the ascent, the immediate price action is one of retreat, not preparation. For this framework to become relevant, the market would first need to absorb this selling pressure and establish a new, stable consolidation pattern directly under the 11.43-11.79 resistance area.

AVAX Continuation Technical Analysis: Directional Flow Assessment
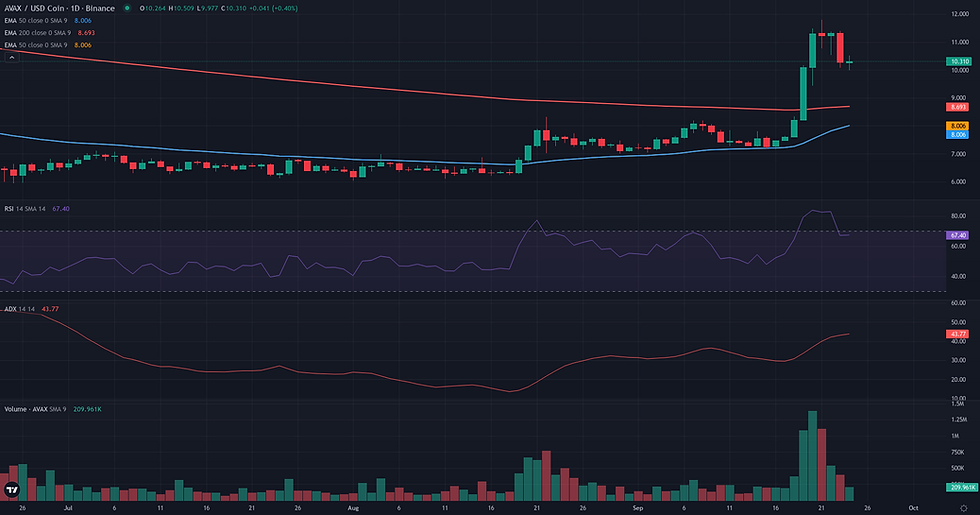
The current market structure for AVAX/USDC presents a classic but contested continuation scenario. A powerful bullish impulse on the daily chart recently broke out of a multi-week consolidation, driving the price from approximately 7.50 to a high of 11.79. This move is supported by strong directional momentum, as indicated by a D1 ADX of 39.57. However, this rally met significant resistance at the weekly 50-period EMA (11.43), a key long-term structural level, triggering the current pullback. The framework's plausibility is therefore borderline, hinging on the nature of this retracement. The pullback has brought the price back towards the Weekly Pivot at 9.99, a logical area for support to form. The fact that this pullback occurred on lower volume than the preceding rally days is a constructive sign, suggesting it may be a consolidation rather than a reversal. The critical test is whether buying pressure re-emerges to defend this support zone. A failure to hold above the 9.99 pivot would challenge the immediate bullish thesis, while a successful defense would keep the continuation framework in play.
Comparative Framework Verdict
In this week's AVAX weekly technical analysis, the three strategic frameworks present a clear hierarchy, though none achieve high plausibility. The Continuation framework emerges as the most relevant scenario, albeit with a 'borderline' rating. It correctly identifies the central conflict in the current market structure: a powerful underlying daily trend clashing with a sharp rejection from major long-term resistance around the $11.43 weekly EMA. The framework's validity hinges on whether the current pullback finds support within its defined validation zone of $9.99-$10.27, which is anchored by the weekly pivot point. A successful defense of this area would keep the bullish continuation thesis in play. Conversely, both the Range/Rebound and Breakout frameworks are deemed 'not plausible'. The Range/Rebound scenario is invalidated by the market's strong trending nature, evidenced by the high ADX reading. The Breakout framework is similarly inapplicable because the price is in a corrective pullback from resistance, not in a phase of compression or coiling beneath it. The market is not preparing to break a level; it is reacting to its failure to do so. Consequently, the immediate focus remains on the quality of the current retracement to determine if it is a constructive pause or the beginning of a more significant correction.
For broader market context, readers can also review the latest related fundamental analysis for this pair.
For live market monitoring and the full interactive chart, readers can access the dedicated AVAX Market Hub.
Disclaimer
CopyTradia provides technical analysis for informational and educational purposes only. This content does not constitute financial advice, investment recommendations, or trading signals. Cryptocurrency markets are highly volatile. Past performance is not indicative of future results. Always conduct your own research (DYOR) and consult a qualified financial advisor before making any investment decisions.


