AVAX Consolidation Analysis: Key Support Holds Amidst Conflict

This AVAX consolidation analysis examines the current AVAX/USDC structure in the context of support defense and weakening alternative frameworks. AVAX/USDC is currently navigating a period of consolidation, with the price holding near a critical support zone around the $7.00-$7.20 level. This follows a strong upward impulse in late August that was met with a subsequent pullback. The market's structure is defined by a significant conflict between timeframes: while the price remains above its short-term 50-day EMA, suggesting some underlying strength, it is still trading well below the long-term 200-day EMA at $8.43, which represents major overhead resistance. Daily momentum indicators reflect this indecision, with an ADX of 30.77 pointing to a trending environment but an RSI of 54.26 sitting in neutral territory. This technical consolidation near key support levels aligns with the latest fundamental analysis, which highlights a period of declining volatility and market re-evaluation for the asset. This complex backdrop sets the stage for several potential scenarios, which will be explored through the Range/Rebound, Breakout, and Continuation frameworks.
AVAX Consolidation Analysis: Technical Framework Assessment
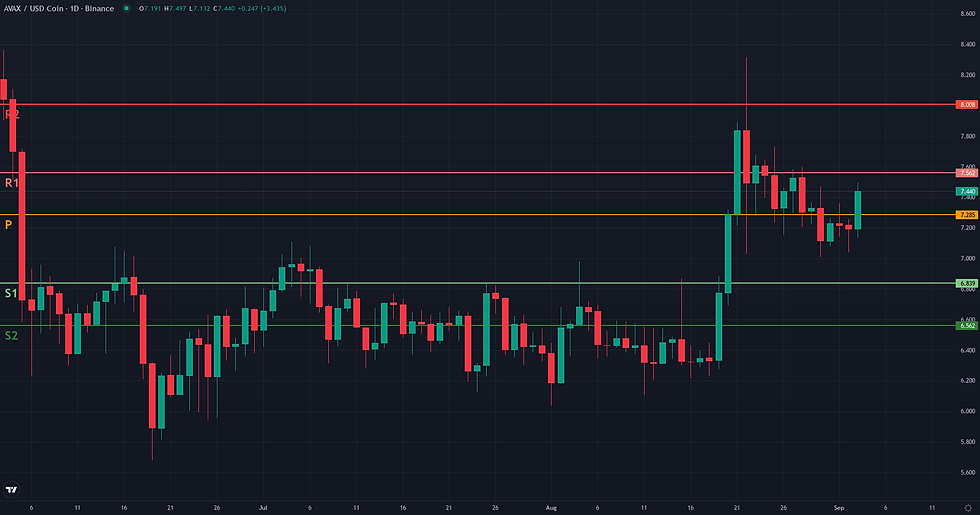
The resolution for the AVAX/USDC Range/Rebound framework is centered on the market's reaction to the validation zone of [7.00, 7.25]. This zone represents a critical structural retest of a prior multi-week resistance, a common technical pattern. The framework's coherence depends on this former ceiling acting as a new floor. The invalidation of this rebound scenario would be defined by a structural failure of this support. A daily close below the 6.94-7.00 cluster, which notably includes the D1 EMA 50 (6.94), would signal that the breakout retest has failed, fundamentally undermining the logic for a rebound and suggesting a potential return to the prior range's lower bounds. Should the support hold, the path upwards is not without obstacles. The first friction zone is tactical, located around the 7.29-7.38 area, marked by a confluence of the daily R1 and weekly pivot points. A more formidable barrier lies at 7.56-7.60, a significant structural resistance defined by the weekly R1 pivot and recent daily highs. Clearing this level is key for confirming the rebound's strength. If the framework confirms by breaking these friction zones, the primary projection zone is the area of the recent major swing high, between the W1 R2 pivot at 8.01 and the peak at 8.32. A more distant structural reference is the D1 EMA 200 at 8.43. Confirmation would involve a daily close above 7.60, while a weakening signal would be a failure to lift off from the validation zone, particularly with price grinding below the D1 S1 pivot at 7.07.

Breakout: Structural Catalyst Assessment
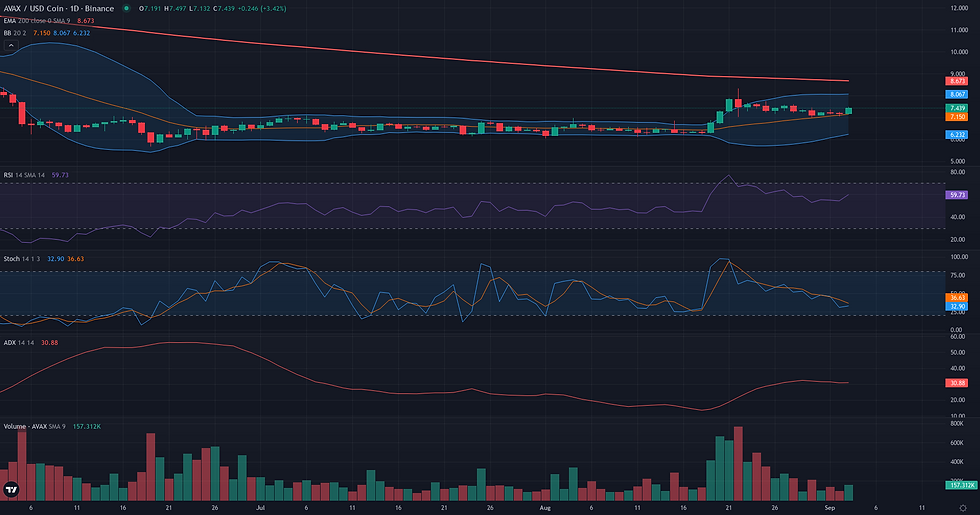
The Breakout framework is currently not plausible for AVAX/USDC. While a significant upward impulse occurred in late August, culminating in a peak at 8.32, the subsequent price action does not exhibit the characteristics of a pre-breakout consolidation. Instead of compressing tightly below this resistance, the price has entered a pullback phase, establishing a lower range. The most significant counter-signal comes from volume dynamics; the D1 Volume Oscillator at -39.32% points to a sharp decline in market participation, which is contrary to the energy accumulation typically required for a structural break. Furthermore, the broader weekly context acts as a major headwind. With the W1 RSI at a bearish 40.95 and the price trading substantially below key long-term averages like the W1 EMA 50 (11.58), the recent daily rally appears to be a counter-trend move within a dominant bearish structure. For this framework to become relevant, the market would need to demonstrate a clear re-acceleration of buying interest through rising volume and establish a sustained consolidation pattern directly challenging the 8.32 resistance zone.

Continuation: Directional Flow Assessment
The technical structure for AVAX/USDC presents a compelling but conflicted case for a bullish continuation. On the daily timeframe, the setup is quite clear: a powerful impulse leg initiated in mid-August propelled the price from approximately 6.30 to a peak of 8.32. This move was followed by a multi-day pullback that has so far demonstrated constructive characteristics. Notably, the price has found support above the D1 EMA50 (currently at 6.94), and the consolidation has occurred on significantly lower volume (Volume Oscillator D1: -39.32), suggesting a lack of aggressive selling pressure. Momentum indicators on this timeframe remain supportive, with the ADX (30.77) confirming a trending environment and the RSI (54.26) holding in bullish territory. However, this optimistic D1 reading is tempered by a strongly bearish weekly context. The price remains far below key weekly moving averages like the W1 EMA50 (11.58), framing the recent daily rally as a counter-trend move within a larger downtrend. The rejection at the 7.73 level last week reinforces this macro pressure. This clash between a constructive daily setup and a dominant weekly downtrend is the primary reason the continuation framework is deemed 'borderline'. While a local continuation is possible, it faces significant headwinds from the higher timeframe structure.

Comparative Framework Verdict
Comparing the three strategic frameworks, the current market structure for AVAX/USDC does not present a single dominant scenario. Instead, it highlights a significant conflict between short-term constructive price action and a persistent long-term bearish trend. Both the Range/Rebound and Continuation frameworks are rated as 'borderline' and describe this tension from slightly different perspectives. The Range/Rebound case is centered on the current test of a structural support confluence around $7.00-$7.10, viewing the price action as a potential bounce from a well-defined floor. Similarly, the Continuation framework sees a valid impulse-pullback pattern on the daily chart, with support holding above the 50-day EMA, but acknowledges that this setup faces strong headwinds from the bearish weekly chart. In contrast, the Breakout framework is deemed 'not plausible'. This conclusion is based on compelling counter-evidence, most notably a sharp decline in trading volume during the recent rally and subsequent pullback. This suggests fading market interest rather than the accumulation of energy typically required for a major structural break above the recent $8.32 high. Ultimately, the market is at an inflection point where neither a clear rebound nor a continuation has been confirmed. The immediate focus is on the defense of the support zone around $7.00. A decisive hold and bounce would lend credibility to both borderline frameworks, while a failure and a daily close below this level would invalidate their bullish premises and signal a likely resumption of the broader downtrend.
For broader market context, readers can also review the latest related fundamental analysis for this pair.
For live market monitoring and the full interactive chart, readers can access the dedicated AVAX Market Hub.
Disclaimer
CopyTradia provides technical analysis for informational and educational purposes only. This content does not constitute financial advice, investment recommendations, or trading signals. Cryptocurrency markets are highly volatile. Past performance is not indicative of future results. Always conduct your own research (DYOR) and consult a qualified financial advisor before making any investment decisions.


