AVAX Breakout Technical Analysis: Consolidation Under $12.00

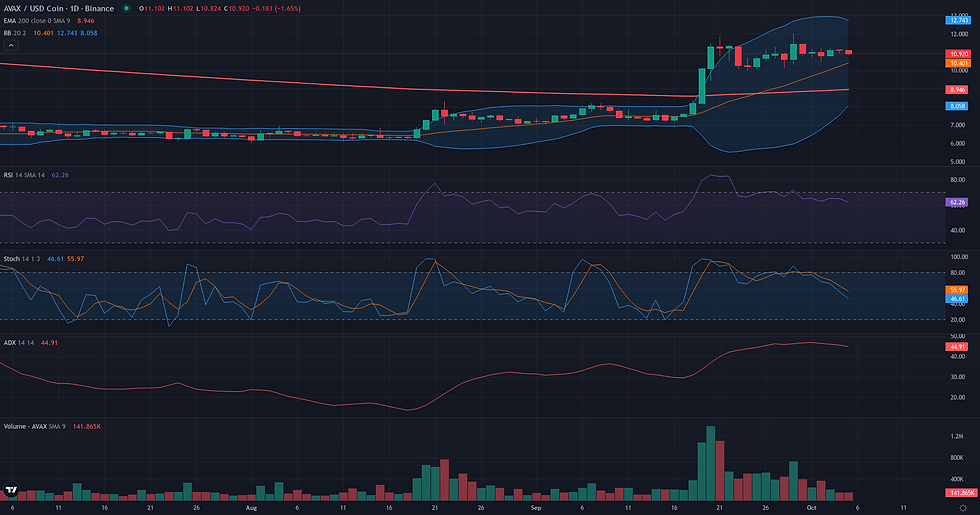
This AVAX breakout technical analysis examines the current AVAX/USDC structure in the context of support defense and weakening alternative frameworks. AVAX/USDC is currently in a phase of tight consolidation following a strong upward impulse, with price action contained between the weekly high of $12.00 and a support base around $10.14. The daily chart reflects a market pausing to absorb recent gains, a technical state underscored by strong underlying trend strength (ADX D1 at 42.47) and bullish but not overextended momentum (RSI D1 at 64.99). This technical consolidation phase directly reflects the fundamental context described in the latest market analysis, where an expansion of leveraged exposure over the past quarter is now being tested after a significant rally. While the price holds firmly above key daily moving averages, it is currently pinned below the weekly 50-period EMA at $11.40, creating a state of equilibrium. The market's next directional move will likely be determined by its ability to resolve this compression, setting the stage for the competing technical frameworks discussed below.

Range & Rebound Resolution: Support and Friction Zones
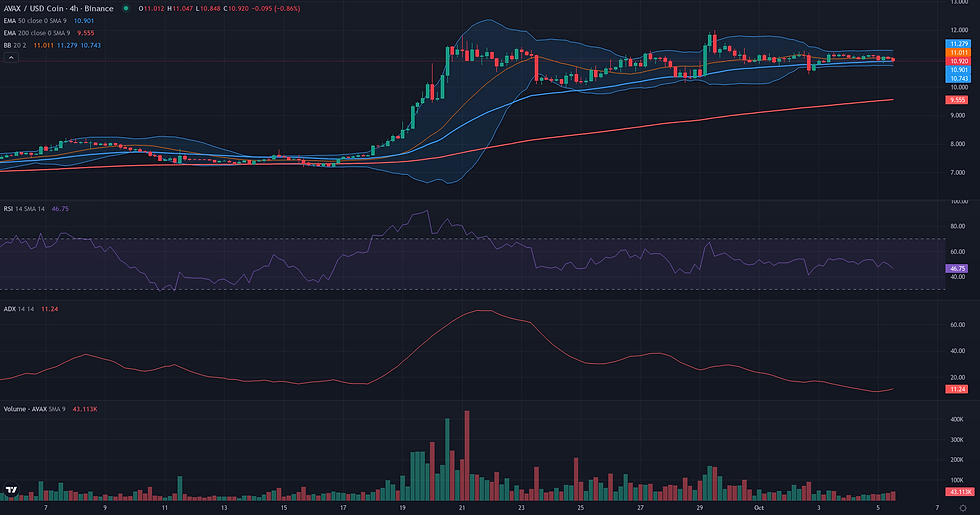
The resolution for the AVAX/USDC Range/Rebound framework is centered on the well-defined consolidation range established after the recent impulse. Starting from the validation zone of 9.98 - 10.16 USDC, which represents the structural floor of this range, the market is currently in a state of equilibrium, hovering around the weekly pivot at 11.08 USDC. This is confirmed by the 4H ADX (9.75), indicating a complete lack of trend. The invalidation of this rebound framework is clearly defined: a daily close below the 9.98 USDC low would break the range structure and negate the potential for a bounce. For the rebound to proceed, it must first navigate a dense area of friction. The immediate obstacle is a resistance cluster between 11.06 and 11.40 USDC, which contains the daily pivot, the weekly pivot, and the significant W1 EMA 50. Overcoming this zone is the first test of bullish strength. If the framework confirms with a move above this friction, the primary technical projection is the top of the range at 12.00 USDC. This level is strongly reinforced by the weekly R1 pivot at 12.02, making it the logical destination for a successful rebound. A breakout beyond this point could target the W1 R2 pivot at 12.94 as a secondary reference. A weakening of the framework would be signaled by a rejection from the current pivot area, particularly with a move below 10.88 (D1 S2), suggesting that momentum is failing and a re-test of the 9.98 support is becoming more probable.
AVAX Breakout Technical Analysis: Structural Catalyst Assessment
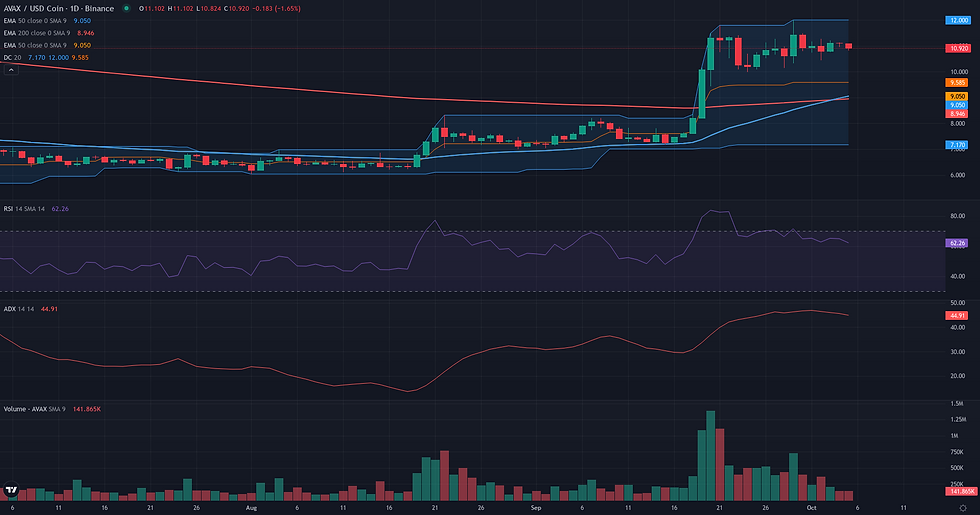
The market structure for AVAX/USDC presents a technically coherent scenario for a potential breakout. A significant horizontal resistance has formed at the 12.00 level, a price point that corresponds to both the 20-day Donchian channel upper band and the high of the preceding week. Following an initial test of this ceiling, price has entered a constructive consolidation phase over the past six sessions. This sideways movement is characterized by a notable decrease in volume, as indicated by a Volume Oscillator of -31.95, a pattern often associated with the absorption of supply before a potential continuation move. This structural preparation is supported by strong underlying momentum. The daily ADX at 42.47 signals a powerful existing trend, while the RSI at 64.99 remains in bullish territory without being overextended, suggesting capacity for further upside. The primary element requiring attention is the weekly context, where the EMA 50 W1 at 11.40 sits just below the 12.00 breakout level. While this moving average represents a potential point of friction, the overall alignment of structure, momentum, and volume on the daily timeframe makes the breakout framework technically plausible.
Continuation: Directional Flow Assessment
The technical structure for AVAX/USDC presents a plausible case for a bullish continuation. The daily chart reveals a robust uptrend, characterized by a clear sequence of higher highs and higher lows following a powerful impulse that peaked at 12.00. This directional move is supported by strong underlying momentum, with the ADX (42.47) indicating a firmly established trend and the RSI (64.99) positioned comfortably in bullish territory without signs of exhaustion or divergence. The current price action is best interpreted as a constructive consolidation. The pullback from the 12.00 high has been orderly, finding support around the 10.14-10.16 area, which aligns with the weekly S1 pivot. This behavior, coupled with declining volume during the pause (Volume Oscillator at -31.95), is typical of a trend resting before its next leg. However, the path forward is not without obstacles. The primary challenge is the weekly 50-period EMA, situated at 11.40, which is currently acting as a ceiling. While the daily trend provides a solid foundation for a continuation, a decisive break above this key weekly average is required to confirm that buyers have regained control and are prepared to challenge the recent highs.

Comparative Framework Verdict
In this week's AVAX weekly technical analysis, two bullish frameworks emerge as plausible while a range-bound scenario is considered borderline. The Breakout and Continuation frameworks are both rated plausible, reflecting the strong underlying daily trend. The Breakout framework is assessed as dominant due to its precise definition of the current market structure: a clear consolidation under the well-defined horizontal resistance at $12.00, supported by constructive volume patterns and strong momentum indicators. This provides a very specific and coherent technical narrative. The Continuation framework is a close secondary. It correctly identifies the robust daily uptrend and views the current sideways price action as a temporary pause. Its validation point, a close above the weekly EMA 50 at $11.40, is a critical hurdle that must be cleared for any breakout to materialize, making it a logical precursor to the dominant framework. The Range/Rebound framework is the weakest of the three and is rated borderline. While it accurately identifies a valid support zone around $9.98-$10.16, its potential is severely limited. Any rebound from this level would immediately encounter significant overhead resistance from the weekly Bollinger Bands and moving averages, making it a contested and low-probability scenario compared to the trend-aligned frameworks. The key level to watch remains the $11.40-$12.00 resistance zone; a decisive move above it would validate the bullish scenarios, while continued rejection would keep the range structure in play.
For broader market context, readers can also review the latest related fundamental analysis for this pair.
For live market monitoring and the full interactive chart, readers can access the dedicated AVAX Market Hub.
Disclaimer
CopyTradia provides technical analysis for informational and educational purposes only. This content does not constitute financial advice, investment recommendations, or trading signals. Cryptocurrency markets are highly volatile. Past performance is not indicative of future results. Always conduct your own research (DYOR) and consult a qualified financial advisor before making any investment decisions.


