AVAX Breakout Analysis: Consolidation Tightens for Next Move

This AVAX breakout analysis examines the current AVAX/USDC structure in the context of support defense and weakening alternative frameworks. AVAX/USDC is currently in a phase of high-level consolidation after a powerful bullish impulse carried the price to a weekly high of 11.79. With the daily close at 10.90, the market structure is defined by this tight range between the recent peak and the weekly low of 9.98. Underlying momentum remains strong, as evidenced by a D1 ADX of 42.68, which confirms a robust trending environment. However, the D1 RSI at 70.70 indicates overbought conditions, often a precursor to either consolidation or a pullback, aligning with the current price action. This technical consolidation aligns with the latest fundamental analysis for this pair, which describes a period of re-evaluation and reduced speculative conviction following a strong monthly rally. The market is now poised at a critical juncture, testing whether the recent gains can be absorbed for another leg higher or if a deeper correction is required.

Range & Rebound: Market Structure Assessment
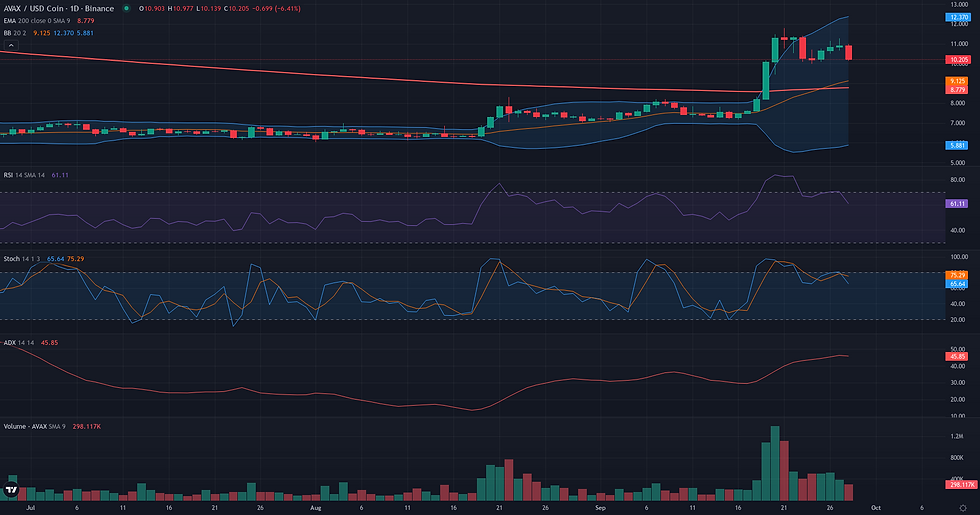
The Range/Rebound framework is currently not plausible for AVAX/USDC as the market structure is fundamentally misaligned with the strategy's core premise. The framework seeks stabilization and a potential reversal from a support zone after a period of decline. Instead, the daily chart displays a powerful bullish impulse, with price surging from the 7.20 area to a recent high of 11.79. This dynamic is confirmed by a high D1 ADX of 42.68, signaling a strong, established trend, and a D1 RSI of 70.70, which indicates overbought conditions rather than the bearish exhaustion the framework looks for. The recent price action is best described as a high-level consolidation following a breakout. Price is currently interacting with the upper weekly Bollinger Band at 10.93, a level more associated with trend extension or potential resistance than a rebound floor. The pullback low around 9.98 acted as a minor retest near the weekly S1 pivot (9.99), but this is characteristic of a trend continuation, not the formation of a bottoming range. For the Range/Rebound framework to become relevant, the market would need to undergo a significant structural change, such as a sustained decline towards a major support like the D1 EMA 200 (currently at 8.33) and the subsequent formation of a clear, multi-week consolidation pattern.
AVAX Breakout Analysis: Structural Catalyst Assessment
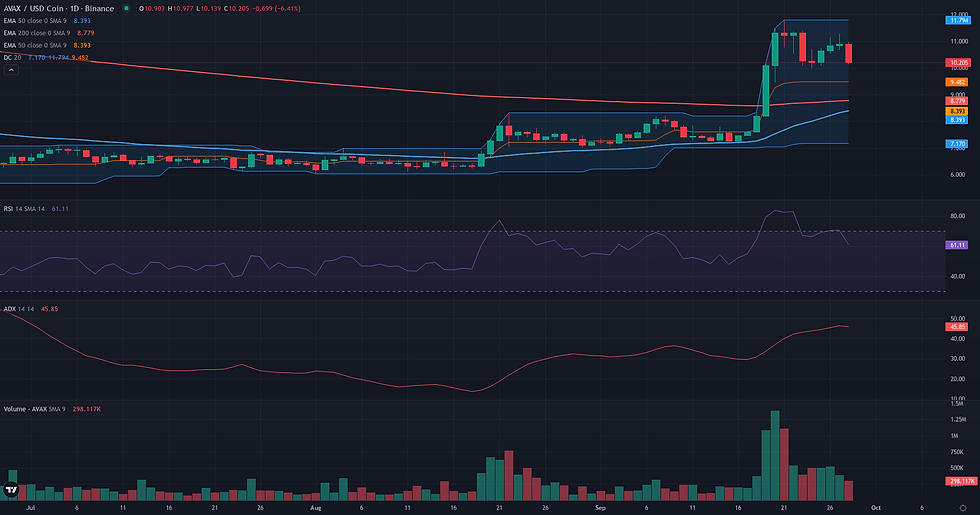
The Breakout framework appears plausible for AVAX/USDC, centered on a highly constructive D1 market structure. The chart displays a classic continuation pattern following a powerful impulse move that peaked at 11.79. For the past week, the price has consolidated in a tight horizontal range, forming a 'bull flag' directly under this well-defined resistance ceiling. This type of compression suggests the market is absorbing the prior move in preparation for a potential next leg up. The reading is strongly supported by underlying dynamics: the D1 ADX at 42.68 confirms a powerful trend is in place, while the volume signature is particularly telling. Volume surged during the ascent and has notably decreased during the consolidation, which is characteristic of accumulation rather than distribution. However, two factors warrant caution. The D1 RSI at 70.70 indicates an overbought condition, which can precede pullbacks. Furthermore, the breakout zone around 11.80 is reinforced by the weekly EMA 50 (11.41), adding a significant layer of potential resistance. Despite this friction, the clarity of the structural pattern and its confirmation by volume dynamics provide a solid basis for the breakout thesis.
Continuation: Directional Flow Assessment
The technical structure for AVAX/USDC presents a plausible continuation scenario, anchored by a recent and powerful bullish impulse. In mid-September, the price broke out of its range with significant force, climbing from approximately 7.60 to a peak of 11.79. This move is supported by strong trend indicators, with the D1 ADX at 42.68 signaling a robust directional environment. Following this peak, the price entered a consolidation phase. Critically, this pullback has so far been constructive, finding solid support around the 9.98-9.99 area, a level that aligns with both the weekly low and the W1 S1 pivot point. The defense of this confluent zone suggests buyer interest and preserves the bullish market structure. However, the reading is not without friction. The weekly context, while showing a clear momentum shift, places the price just below the W1 EMA50 at 11.41, a potential resistance zone. Furthermore, the H1 micro-chart reveals short-term selling pressure, creating a divergence with the broader D1 outlook. Despite these moderating factors, the integrity of the D1 impulse and the successful test of key support form the primary basis for considering the continuation framework as plausible.

Comparative Framework Verdict
Comparing the three technical frameworks, a clear consensus emerges favoring trend-following scenarios. The Breakout framework is assessed as the most dominant plausible scenario. It identifies a classic 'bull flag' pattern, a form of consolidation just below the key resistance at 11.79, supported by a textbook volume signature of declining activity. A sustained move above 11.81 would validate this interpretation. Complementing this view, the Continuation framework is also plausible and serves as a strong secondary reading. It focuses on the constructive nature of the recent pullback, which found solid support at the 9.98-9.99 confluence zone, confirming buyer interest and preserving the bullish structure. Both frameworks highlight the strength of the underlying trend. In stark contrast, the Range/Rebound framework is deemed not plausible. The market's high momentum, confirmed by an elevated ADX and overbought RSI, directly contradicts the conditions of range-bound exhaustion required for a rebound. Consequently, the key levels to monitor are the resistance ceiling around 11.81 and the support floor at 9.98, as price action at these boundaries will likely determine the market's next directional move.
For broader market context, readers can also review the latest related fundamental analysis for this pair.
For live market monitoring and the full interactive chart, readers can access the dedicated AVAX Market Hub.
Disclaimer
CopyTradia provides technical analysis for informational and educational purposes only. This content does not constitute financial advice, investment recommendations, or trading signals. Cryptocurrency markets are highly volatile. Past performance is not indicative of future results. Always conduct your own research (DYOR) and consult a qualified financial advisor before making any investment decisions.


