SEI Range Rebound Analysis: Support Holds Firm
- CopyTradia Intelligence

- Jun 22
- 5 min read
This SEI range rebound analysis examines the current SEI/USDC structure in the context of support defense and weakening alternative frameworks. SEI/USDC is currently defined by a clear technical conflict between its daily and weekly timeframes. The price has entered a distinct consolidation phase on the daily chart, oscillating between approximately 0.05 and 0.06 USDC. This sideways movement is confirmed by a very low D1 ADX of 14.14, indicating a lack of directional trend and a market in equilibrium. The D1 RSI sits near the neutral midpoint at 46.96, reinforcing this state of indecision. However, this stabilization occurs within the context of a powerful weekly downtrend, with the price trading significantly below its major moving averages, such as the W1 EMA 50 at 0.14. This technical stabilization at a key support confluence aligns with recent market analysis highlighting Sei's relative strength and internal resilience despite broader market apprehension. The current structure therefore presents a pause, where the market must decide whether to build a base for a rebound or resume its broader bearish trajectory.
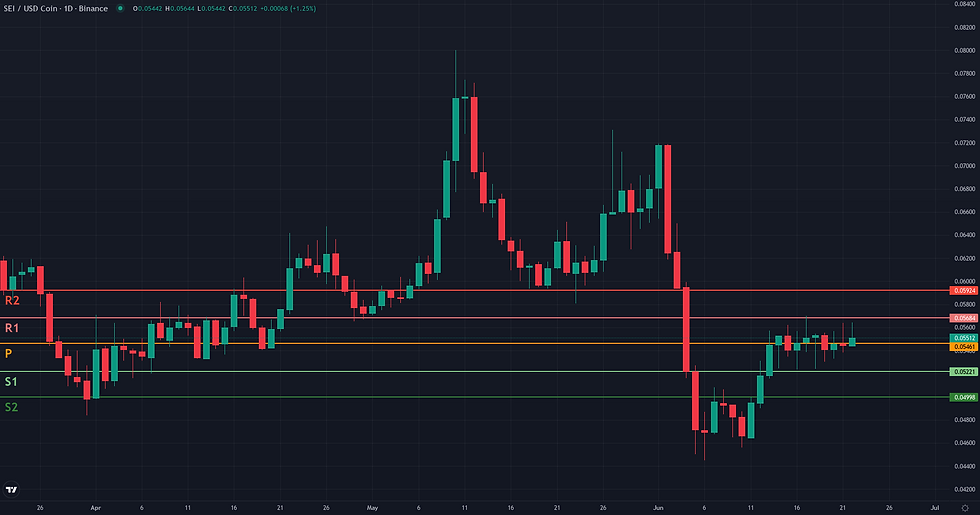
SEI Range Rebound Analysis: Support and Friction Zones
The resolution of the Range/Rebound framework for SEI/USDC is centered on the critical D1 price range between 0.05 and 0.06 USDC. The validation for a potential rebound requires a sustained move into the [0.06, 0.062] zone, but this area represents a formidable barrier. The 0.06 level is not just the range top; it's a dense confluence of technical resistance, including the D1 EMA 50, the daily R1 pivot, and the weekly R1 and R2 pivots. This makes it the primary friction zone, where the balance of power between buyers and sellers will be decided. Current 4H data shows a distinct lack of conviction, with a low ADX (17.47) and a negative Volume Oscillator (-38.31), suggesting the market is not yet prepared to support a breakout. The framework would lose its coherence if the price fails to hold the range support. The invalidation zone is defined by a daily close below the 0.05 USDC floor. This level is a significant support cluster, anchored by multiple daily and weekly pivots, and its failure would signal that the recent consolidation was merely a pause in the larger weekly downtrend. For the rebound to gain credibility, a confirmation condition would be a daily close above the 0.06 resistance cluster, preferably with a notable increase in volume. If such a breakout occurs, the first significant projection zone lies at the D1 EMA 200 around 0.09 USDC. A more distant, macro projection would be the W1 EMA 50 at 0.14 USDC, though this remains a highly ambitious reference given the prevailing bearish context.
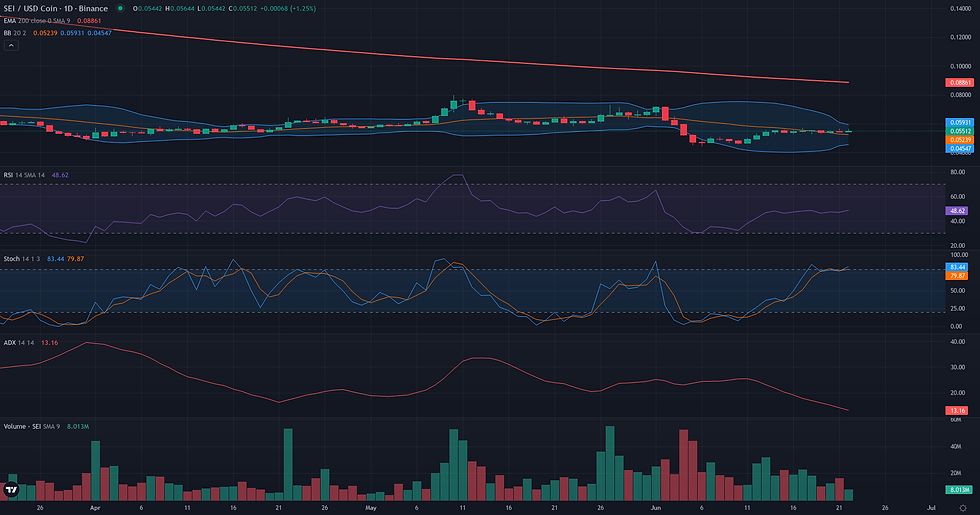

Breakout: Structural Catalyst Assessment
The Breakout framework is currently not plausible for SEI/USDC. The market structure lacks the necessary conditions for a structural break to the upside. On the daily timeframe, the price is caught in a low-volatility range between approximately 0.05 and 0.06 USDC, but this does not represent a constructive compression against resistance. Instead, key indicators point to a complete absence of directional energy, with the ADX D1 at a very low 14.14 and the RSI D1 hovering below the neutral 50 mark at 46.96. This suggests market indecision rather than the accumulation of pressure typical of a pre-breakout phase. More critically, the weekly context is strongly bearish. Price is trading significantly below its major weekly moving averages (EMA 50 W1 at 0.14), and the weekly ADX at 37.20 confirms a powerful, ongoing downtrend. Attempting a bullish breakout in such a context would be a low-probability, counter-trend scenario. For this framework to become relevant, the structure would need to fundamentally change, requiring a sustained move above the 0.07 USDC resistance, accompanied by a clear resurgence in daily momentum and a stabilization of the weekly trend.

Continuation: Directional Flow Assessment
The Continuation framework is currently not plausible for SEI/USDC as the market structure on the daily timeframe lacks the necessary directional character. Price action has been confined to a tight consolidation range for several weeks, primarily between 0.05 and 0.06. This lack of trend is quantitatively confirmed by the ADX D1 indicator, which sits at a very low 14.14, signaling a distinct absence of directional flow. While the weekly context presents a strong, established downtrend (ADX W1 at 37.20), the daily chart is not forming a classic continuation pattern like a flag or a shallow pullback. Instead, it displays a prolonged sideways grind, creating a significant disconnect between the two timeframes. This suggests a pause or equilibrium phase rather than a market ready to continue its prior trajectory. The neutral D1 RSI (46.96) and negative Volume Oscillator (-20.98) further reinforce this reading of indecision and low conviction. For a Continuation framework to become relevant, the market would first need to establish a new directional impulse by decisively breaking out of the current D1 range with a corresponding increase in momentum.

Comparative Framework Verdict
Comparing the three technical frameworks, the market structure for SEI/USDC clearly invalidates directional scenarios, leaving the Range/Rebound framework as the most relevant, albeit with a 'borderline' plausibility. The Breakout and Continuation frameworks were both deemed 'not plausible' due to the complete absence of directional momentum on the daily chart. The D1 ADX reading of 14.14 is a strong quantitative signal of a ranging, non-trending market, which directly contradicts the core requirements for either a breakout or a trend continuation. The Range/Rebound framework, while not fully plausible, accurately captures the current price action, which is confined between a solid support floor at 0.05 USDC and a resistance ceiling at 0.06 USDC. Its 'borderline' status stems from the significant risk posed by the strong underlying weekly downtrend (W1 ADX at 37.20), which suggests any rebound attempt is a counter-trend move. The resolution of this conflict hinges on the boundaries of this range. A confirmed break above the 0.06 resistance would be needed to validate a potential rebound, while a failure and subsequent breakdown below the 0.05 support would likely signal a resumption of the macro downtrend.
For broader market context, readers can also review the latest related fundamental analysis for this pair.
For live market monitoring and the full interactive chart, readers can access the dedicated SEI Market Hub.
Disclaimer
CopyTradia provides technical analysis for informational and educational purposes only. This content does not constitute financial advice, investment recommendations, or trading signals. Cryptocurrency markets are highly volatile. Past performance is not indicative of future results. Always conduct your own research (DYOR) and consult a qualified financial advisor before making any investment decisions.


