Sei Market Dynamics: Relative Strength Amidst Broader Fear
- CopyTradia Intelligence

- Jun 22
- 3 min read
Sei concluded the week with minor price depreciation, yet demonstrated a notable degree of relative strength against Bitcoin, contrasting with the prevailing 'Extreme Fear' sentiment across the broader crypto market. This internal resilience in Sei market dynamics suggests a nuanced positioning environment, where autonomous performance is observed despite general market apprehension.
Sei Price Action and Volatility
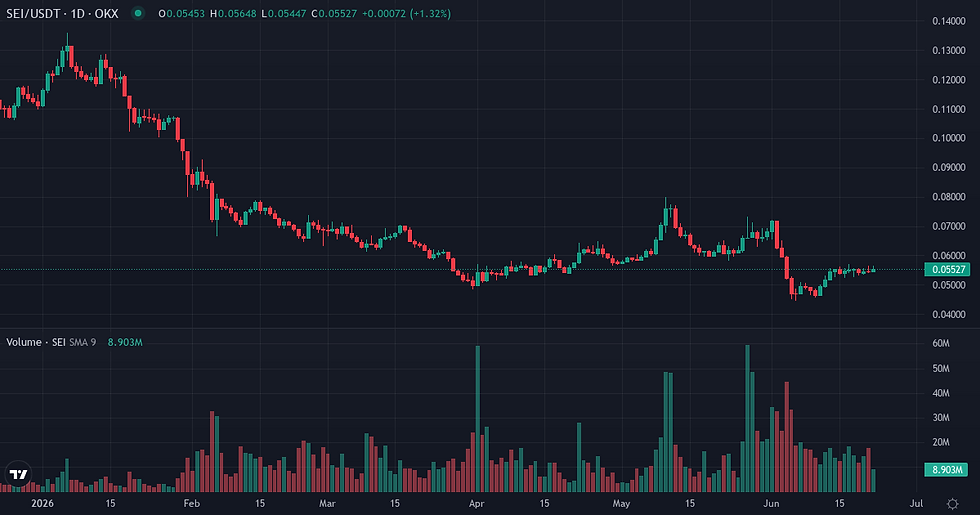
Sei's price action registered a -0.75% decline over the past seven days, extending its 30-day depreciation to -7.13%. Despite these declines, the asset posted a +4.3530% relative performance against Bitcoin over the same seven-day period, building on a +3.7266% outperformance over 30 days. This indicates a degree of decoupling from the benchmark's immediate movements. Realized volatility for the 7-day period stood at 85.13%, remaining close to its 90-day baseline of 88.12%, suggesting a stable volatility regime. The asset currently trades 95.16% below its all-time high, a structural anchor reflecting its long-term position. Volume momentum, measured by the 24-hour volume against the 7-day average, was at 1.182, indicating slightly elevated recent trading activity.

Metric | Value |
SEI Price | $0.06 (-0.55% 24h / -0.75% 7d / -7.13% 30d) |
Volume 24h | $28.6M |
Native Quote Vol. 24h | $953,266 |
Market Cap | $372.3M |
Market Cap Rank | 122 |
Circulating Supply | 6.73B SEI |
ATH Distance | 95.16% below ATH |
Metric | Value |
SEI/BTC Ratio | 0.00000100 |
Relative Perf. 7d vs BTC | +4.35% |
Relative Perf. 30d vs BTC | +3.73% |
Sei Speculative Positioning Analysis
Speculative positioning for Sei shows Open Interest at $0.011 billion, slightly below its 90-day baseline of $0.012 billion, though it recorded a modest +0.89% increase over the last seven days. The current funding rate is marginally negative at -0.000958%, with a 7-day cumulative rate of -0.007021%. The 30-day funding Z-score of 0.4526 suggests that while funding is negative, it is not at extreme lows relative to its recent average. Liquidation data for the past seven days indicates a significant skew towards long positions, with $2.9 million (85.9%) liquidated compared to $0.5 million (14.1%) in short liquidations. However, the 30-day average liquidation profile shows a more balanced directional skew, with 77.2% long and 22.8% short, suggesting that the recent long-sided liquidations might be a short-term event rather than a sustained trend.
Metric | Value |
Funding Rate (current) | -0.0010% |
Funding Cumul. 7d | -0.0070% |
Open Interest | $0.01B (+0.89% 7d) |
Liq. 24h Longs | $0M |
Liq. 24h Shorts | $0M |
Liq. 7d Longs | $3M |
Liq. 7d Shorts | $0M |
Metric | Value |
Realized Vol 7d | +85.13% (90d avg: +88.12%) |
Realized Vol 30d | +102.00% |
Corr. BTC 30d | 0.6549 (90d avg: 0.6869) |
Beta vs BTC | 1.3260 |
Volume Momentum | 1.1820x |
Funding Z-Score 30d | 0.45σ |
Turnover Ratio | 0.0768 |
Liq. Intensity | 0.00911 |
Key Catalysts for Sei Performance
The continuation of Sei's outperformance against Bitcoin, particularly as the broader crypto market remains in a state of 'Extreme Fear,' would indicate a consolidation of its current autonomous strength. A notable expansion in Open Interest coupled with a significant shift in funding rates, either towards sustained negative values or a rapid positive reversal, would signal a material change in speculative conviction. The market's reaction to upcoming macro releases, specifically the Core PCE Price Index, Final GDP, and Unemployment Claims data on June 25th, could introduce external volatility that either challenges Sei's relative resilience or provides a broader directional impulse.
Indicator | Value | Variation |
Broad Dollar Index | 119.51 | flat (7d) |
US 10Y Yield | 4.49% | +0.02pp (7d) |
Fed Balance Sheet | $6736B | +$11,027M (7d) |
M2 Money Supply | $22,805B | +$118.1B (1m) |
Fear & Greed | 20 (Extreme Fear) | -3 pts (7d) |
Fear & Greed Index: Alternative.me
Sei Weekly Takeaway
Sei concludes the week exhibiting an internal regime characterized by relative strength against Bitcoin, even as the broader market experiences 'Extreme Fear.' While spot price action has been subdued, the sustained outperformance against BTC suggests an underlying demand or reduced selling pressure specific to Sei. Derivatives positioning shows a degree of tension, with recent long liquidations contrasting with a more balanced 30-day average and Open Interest slightly below its baseline. For swing traders, this implies a market where internal dynamics are currently more influential than broad market sentiment, but where shifts in leveraged positioning could quickly alter the current equilibrium.
Disclaimer
This article provides a fundamental analysis of Sei based on available market data and does not constitute investment advice or a recommendation to buy or sell any asset.


