SEI Consolidation Analysis: Tight Range vs. Weekly Downtrend
- CopyTradia Intelligence

- Jun 25
- 5 min read
This SEI consolidation analysis examines the current SEI/USDC structure in the context of support defense and weakening alternative frameworks. SEI/USDC is currently defined by a period of tight consolidation, with price action largely contained within a narrow weekly range between 0.05 and 0.06. This sideways movement is technically confirmed by an extremely low D1 ADX of 12.49, indicating a distinct lack of directional trend, while the D1 RSI hovers near the neutral 50 mark. The price is presently testing the upper boundary of this range at 0.06, a level that also coincides with the 50-day EMA. However, this daily stabilization occurs within a broader, powerful weekly downtrend, with the price remaining significantly below key long-term moving averages. This period of technical stabilization aligns with recent fundamental observations of SEI's relative strength, where the asset has shown resilience despite broader market apprehension and 'Extreme Fear' sentiment. The current structure therefore presents a classic conflict between short-term neutrality and long-term bearish pressure, setting the stage for a potentially decisive directional move.
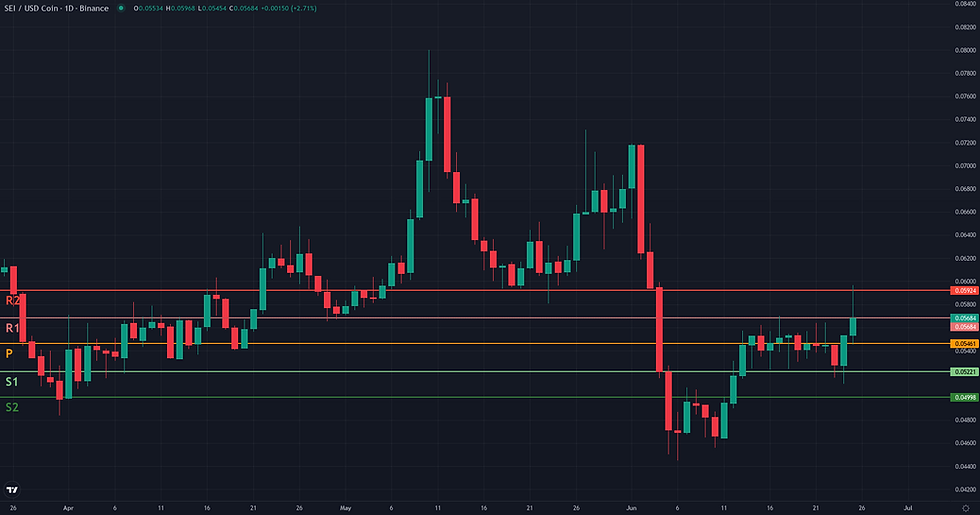
SEI Consolidation Analysis: Technical Framework Assessment
Following the validation of a rebound from the 0.05 support level, the SEI/USDC range framework faces its decisive test. The price is now challenging the upper boundary of its daily consolidation range at 0.06, a level fortified by a dense cluster of technical resistances. The resolution of this framework depends entirely on how the market reacts to this critical zone. The invalidation zone for this rebound scenario is clearly defined. A daily close below the structural support at 0.05 would break the range's integrity. Such a move would invalidate the stabilization attempt and signal that the dominant weekly downtrend is resuming control, potentially leading to further downside exploration. Conversely, the path higher is met with immediate and significant friction at the 0.06 resistance. This level is not just the range top but also a confluence of the D1 EMA 50 and multiple daily and weekly pivot points. The high 4H RSI (68.44) suggests the current push is extended, making this zone a likely point of contention where sellers may re-emerge. Should the rebound gather enough strength to achieve a confirmed daily close above 0.06, it would confirm the framework's strength. This would open the door to higher projection zones, with the first reference at the 0.07 prior structural high, and a more significant target at the D1 EMA 200 around 0.09. A rejection at 0.06 would act as a weakening condition, signaling the rebound lacks the momentum to escape the range.
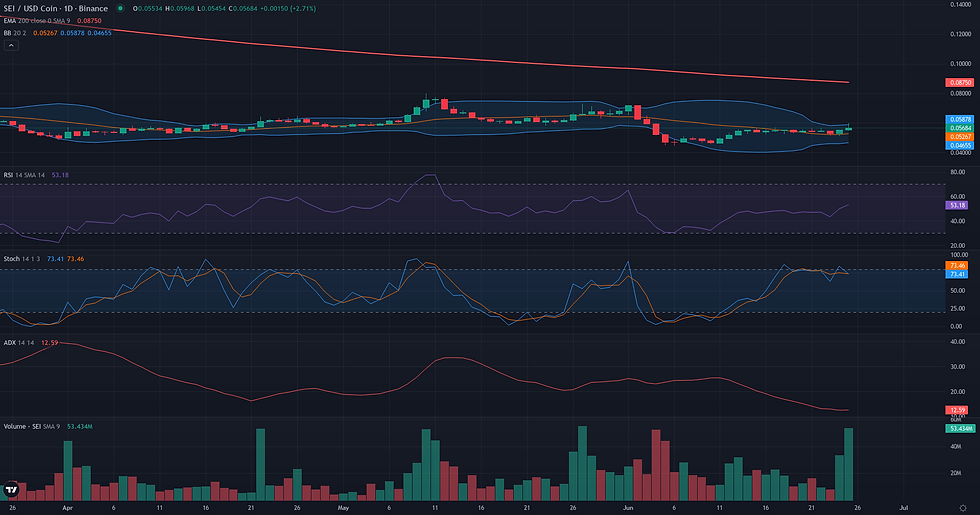

Breakout: Structural Catalyst Assessment
The Breakout framework for SEI/USDC presents a borderline case, characterized by a sharp conflict between a constructive daily structure and a hostile weekly context. On the daily timeframe, the market has formed a textbook consolidation pattern, with price compressing for several weeks within a tight range between 0.05 and 0.06. This compression is technically confirmed by extremely narrow Bollinger Bands and a very low ADX reading of 12.49, signaling a deeply non-trending state ripe for a directional move. The 0.06 level has emerged as a critical resistance ceiling, reinforced by a confluence of technical indicators including the 20-day Donchian high, the daily EMA 50, and the weekly R1 pivot. A recent bullish engulfing candle with a notable volume spike suggests an initial attempt to challenge this ceiling. However, this promising daily setup is directly opposed by the weekly chart, which remains in a strong, established downtrend (W1 ADX at 37.20). With price far below major weekly averages, any upward breakout on the daily chart would constitute a counter-trend move, facing significant structural headwinds. This tension between the potential for a local breakout and the pressure from the dominant trend is what defines the situation as borderline.
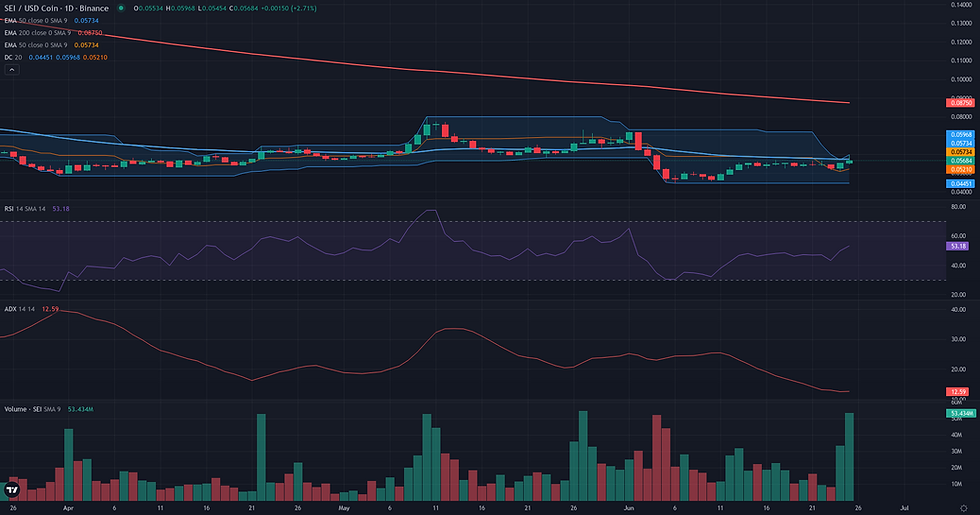
Continuation: Directional Flow Assessment
The Continuation framework is assessed as not plausible for SEI/USDC at this time. The primary reason is the absence of a clear directional trend on the daily timeframe, which is a prerequisite for a continuation scenario. The market structure is best described as a consolidation range, a fact strongly corroborated by the D1 ADX indicator, which stands at an exceptionally low 12.49, signaling a distinct lack of trend. For over a month, price action has been contained between approximately 0.05 and 0.07. While the most recent daily candle was a bullish engulfing pattern from the lower end of this range, and H1 data shows a push towards the 0.06 pivot, this buying pressure currently represents an oscillation within the range rather than the start of a new, sustained directional move. The broader weekly context remains bearish, with price significantly below key moving averages like the W1 EMA200 (0.35), but even this bearish trend has paused. For the Continuation framework to become relevant, the market would first need to establish a clear directional bias by breaking out of this consolidation, either above 0.07 to initiate a potential new uptrend or below 0.05 to resume the longer-term downtrend.

Comparative Framework Verdict
In this week's SEI technical analysis, the market structure presents a clear conflict between a consolidating daily timeframe and a dominant weekly downtrend, leading to a situation where no single framework is clearly dominant. Both the Range/Rebound and Breakout frameworks are assessed as borderline. They each correctly identify the prevailing market condition: a tight consolidation between the 0.05 support and 0.06 resistance, confirmed by an exceptionally low D1 ADX. The Range/Rebound framework focuses on the oscillation within these boundaries, while the Breakout framework anticipates a directional move out of this compression. However, both are weakened by the same critical factor: the strong weekly bearish trend, which suggests any upward movement is a high-risk, counter-trend play. Conversely, the Continuation framework is deemed not plausible. Its core requirement for a stable, directional trend is directly contradicted by the market's clear range-bound state and low momentum readings. With two borderline frameworks describing different outcomes of the same pattern and one invalid framework, the verdict is that no single scenario holds a technical advantage. The market's immediate direction hinges on the resolution of the 0.05-0.06 range. A sustained break below 0.05 would invalidate the consolidation and realign with the weekly downtrend, whereas a confirmed move above the 0.06 resistance cluster would be required to suggest a more significant counter-trend rally is underway.
For broader market context, readers can also review the latest related fundamental analysis for this pair.
For live market monitoring and the full interactive chart, readers can access the dedicated SEI Market Hub.
Disclaimer
CopyTradia provides technical analysis for informational and educational purposes only. This content does not constitute financial advice, investment recommendations, or trading signals. Cryptocurrency markets are highly volatile. Past performance is not indicative of future results. Always conduct your own research (DYOR) and consult a qualified financial advisor before making any investment decisions.


