NEAR Range Rebound Analysis: Price Stabilizes in Support Zone
- CopyTradia Intelligence

- Jun 25
- 5 min read
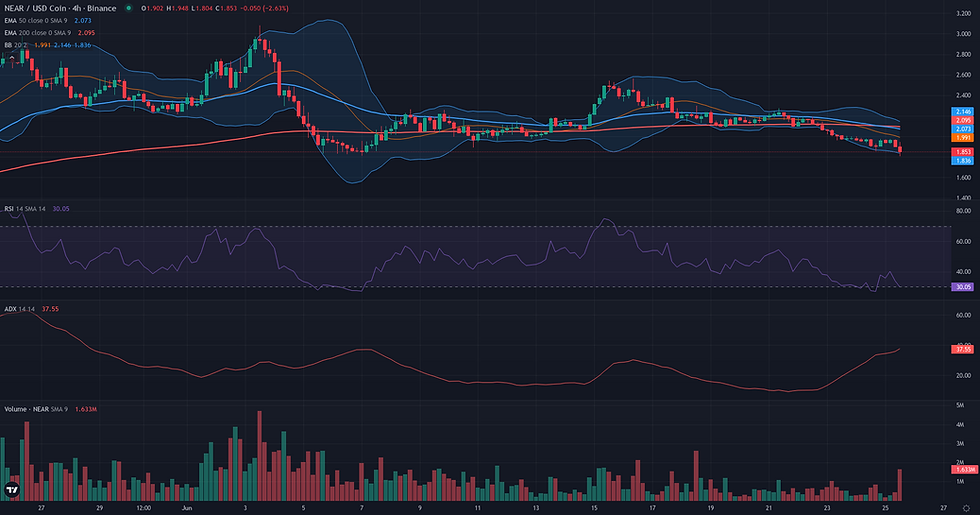
This NEAR range rebound analysis examines the current NEAR/USDC structure in the context of support defense and weakening alternative frameworks. NEAR/USDC is currently in a phase of technical consolidation after failing to sustain its upward momentum earlier in June. The price has since established a support base above the $1.81 low, trading near $1.96 at the time of analysis. This price action is caught between the long-term support of the 200-day EMA at $1.76 and immediate resistance from the 50-day EMA at $2.01. The market's lack of directional conviction is clearly reflected in its key indicators: the daily ADX sits at a non-trending value of 24.82, while the RSI at 43.83 confirms that bullish momentum has yet to return. This technical consolidation occurs against a fundamental backdrop of elevated volatility and significant market deleveraging, suggesting the current price stability may be a result of exhausted sellers rather than renewed buying conviction. The current structure sets the stage for a critical test of the established support range, with different technical frameworks offering contrasting views on the potential resolution.

NEAR Range Rebound Analysis: Support and Friction Zones
The Range/Rebound framework for NEAR/USDC, established on a plausible stabilization within the 1.85 - 1.94 support zone, now faces its critical resolution phase. The integrity of this framework hinges on the market's reaction from this key structural floor. The primary invalidation condition for this rebound scenario would be a decisive failure of this support. A daily close below the 1.80 level, which corresponds to the D1 S2 pivot, would signal that the consolidation has resolved to the downside, breaking the multi-week structure and negating the rebound thesis. Should a bounce materialize, its path is not without obstacles. The first friction zone lies at 2.01-2.02, a confluence of the daily EMA 50 and the D1 R1 pivot. Overcoming this is necessary to build momentum. A more formidable barrier is located around the weekly pivot at 2.25, which has capped recent upside attempts and defines the upper boundary of the immediate range. A firm close above this level would serve as a strong confirmation of the rebound, shifting the market structure. If confirmed, the framework projects towards the W1 R1 pivot at 2.41 as a primary technical reference. A sustained rally could then target the next major resistance cluster around the W1 R2 pivot at 2.73. Currently, the framework is being tested, and a failure to generate upward momentum from the validation zone would be a significant sign of weakness, placing the invalidation level at risk.

Breakout: Structural Catalyst Assessment
The Breakout framework is currently not plausible for NEAR/USDC. The market structure does not exhibit the necessary pre-breakout compression but rather a clear pattern of rejection and subsequent weakness. Following a failed attempt to establish new highs, which culminated in a significant weekly rejection from the 3.08 level, the price has entered a bearish drift. The more immediate resistance at 2.56 was tested on June 16th and has since been followed by a consistent decline, with the price moving away from this potential breakout zone. This structural weakness is corroborated by key technical indicators. The price is currently trading below its D1 50-period EMA (2.01) and the Bollinger Bands' middle line (2.11), signaling a loss of short-term bullish control. Momentum is lacking, as shown by a D1 RSI of 43.83, which is firmly in bearish territory. Critically, the Volume Oscillator at -35.22 highlights a severe lack of buying interest, a condition that is fundamentally at odds with the energy accumulation required for a sustainable breakout. For this framework to become relevant, the market would need to reverse its current trajectory, establish a solid consolidation base directly under the 2.56 resistance, and demonstrate a significant resurgence in both momentum and volume.

Continuation: Directional Flow Assessment
The Continuation framework is currently not plausible for NEAR/USDC. The market structure does not exhibit the required 'Stable Directional Flow' signature. Following a peak at $3.08 in early June, the prior uptrend has broken down, giving way to a multi-week corrective phase characterized by indecision and a bearish bias. Price is currently navigating below key dynamic resistances, including the D1 EMA 50 at $2.01 and the tactical 4H EMA 200 at $2.11. This price position, combined with a bearish D1 RSI of 43.83, signals that sellers currently have the upper hand. Furthermore, the lack of a clear trend is highlighted by a D1 ADX of 24.82 and a negative Volume Oscillator, suggesting low conviction from market participants. While the price remains above the long-term D1 EMA 200 ($1.76), this merely defines a potential support floor rather than confirming an active continuation. For this framework to become relevant, the market would need to first establish a new bullish structure by reclaiming key resistance levels and demonstrating a clear shift back into a positive momentum regime.

Comparative Framework Verdict
A comparative analysis of the three strategic frameworks reveals a clear technical hierarchy for NEAR/USDC this week. The Range/Rebound scenario stands out as the only plausible framework, grounded in the market's recent price action. It identifies a well-defined support zone between $1.85 and $1.94, which has been repeatedly tested and held over the past three weeks. This thesis is strengthened by a non-trending daily ADX and a strongly negative Volume Oscillator, both pointing to seller exhaustion and a period of structural stabilization. In contrast, both the Breakout and Continuation frameworks are deemed not plausible. The Breakout scenario is invalidated by the price's clear retreat from key resistance levels and a significant lack of buying volume. Similarly, the Continuation framework is inapplicable as the prior uptrend structure has been broken, and the market is now in a corrective phase below key moving averages. The dominance of the Range/Rebound framework focuses attention on the integrity of its support zone. For a bullish resolution to gain credibility, the price must first overcome initial resistance around $2.01-$2.02 before challenging the more significant barrier near the $2.25 weekly pivot. The immediate focus remains on whether buyers can defend the current support floor.
For broader market context, readers can also review the latest related fundamental analysis for this pair.
For live market monitoring and the full interactive chart, readers can access the dedicated NEAR Market Hub.
Disclaimer
CopyTradia provides technical analysis for informational and educational purposes only. This content does not constitute financial advice, investment recommendations, or trading signals. Cryptocurrency markets are highly volatile. Past performance is not indicative of future results. Always conduct your own research (DYOR) and consult a qualified financial advisor before making any investment decisions.


