AVAX Range Rebound Analysis: Support Tested Amid Bearish Trend

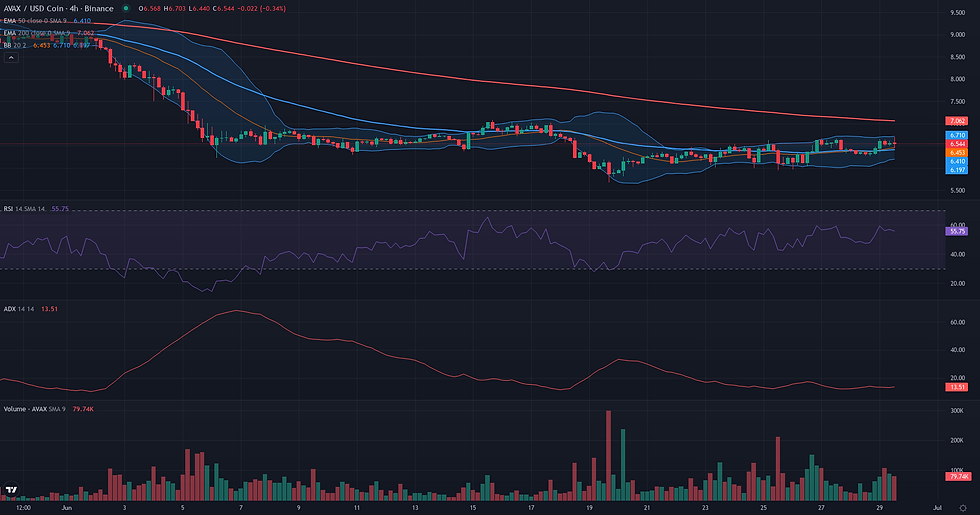
This AVAX range rebound analysis examines the current AVAX/USDC structure in the context of support defense and weakening alternative frameworks. AVAX/USDC is currently navigating a period of intense technical conflict, consolidating near the weekly low after a significant downtrend. With a daily close at 6.44 USDC, the price is caught in a narrow range, defined by a weekly low of 5.95 and a high of 6.67. The market's structure is defined by a powerful underlying bearish trend, confirmed by an extremely high D1 ADX of 53.98 and the price trading well below its key daily moving averages. However, momentum is showing signs of pausing, with the D1 RSI at a neutral-bearish 41.20. This technical consolidation aligns with recent fundamental observations of a tension between short-term recovery attempts, evidenced by AVAX's relative strength, and longer-term bearish positioning in a market characterized by extreme fear. The current price action reflects this indecision, as the asset attempts to establish a support base against the pressure of the dominant trend.

AVAX Range Rebound Analysis: Support and Friction Zones
Following the borderline assessment, the resolution of the AVAX/USDC range rebound framework depends on its ability to overcome significant structural resistance while respecting key support levels. The validation condition remains a daily close above the 6.67 - 6.99 USDC zone. This would confirm a breakout from the immediate consolidation range and signal a potential shift in market dynamics. The framework would lose its technical coherence if the price closes on a daily basis below the recent swing low of 5.95 USDC. Such a move would negate the developing higher-low structure, which is the cornerstone of the rebound thesis, and would likely signal a continuation of the powerful underlying downtrend. Should the framework validate, it will immediately face a significant friction zone between 6.76 USDC (Weekly R1 pivot) and 7.08 USDC (prior weekly high). This area represents a confluence of resistance that must be decisively cleared. Beyond this, the next major obstacle is the daily EMA 50 at 7.51 USDC, a key indicator of the medium-term trend. If the rebound gains traction and overcomes these hurdles, the first technical projection zone lies around 7.90 - 8.17 USDC, a former support/resistance area. A more extended move could target the 8.65 - 9.00 USDC consolidation zone from late May. Confirmation of strength would be seen in the price holding above 6.76 USDC, while a rejection from the validation zone would be a clear sign of weakening, putting the 5.95 USDC invalidation level at risk.

Breakout: Structural Catalyst Assessment
The Breakout framework is assessed as not plausible for AVAX/USDC at this time. The market structure is in direct opposition to the core requirements of a pre-breakout scenario, which typically involves price compression below a well-defined resistance. Instead, the asset is situated within a strong, multi-timeframe downtrend. This is evidenced by the price trading significantly below its Daily EMA50 (7.51) and Weekly EMA50 (13.68). The strength of this bearish trend is not diminishing; it is confirmed by a very high D1 ADX of 53.98, indicating a powerful, directional market rather than a period of equilibrium. Momentum indicators corroborate this reading, with the D1 RSI at a weak 41.20 and the W1 RSI near oversold levels at 31.46, showing no signs of underlying strength building for a bullish resolution. For this framework to become relevant, the market would first need to neutralize the current downtrend by establishing a sustained consolidation base and subsequently reclaiming key moving averages.

Continuation: Directional Flow Assessment
The Continuation framework is assessed as not plausible for AVAX/USDC at this time. While the broader weekly and daily contexts remain structurally bearish—with price trading significantly below key moving averages like the D1 EMA 50 at 7.51 and the W1 EMA 50 at 13.68—the immediate price action on the daily chart invalidates the core 'Stable Directional Flow' requirement. The sharp downtrend observed in early June has given way to a clear consolidation phase over the past ten days, with price action contained within a range. This pause is confirmed by a D1 RSI that has moved from oversold territory to a neutral 41.20, signaling a halt in bearish momentum. Furthermore, short-term H1 charts show minor bullish pressure, creating a multi-timeframe conflict rather than the required coherence. For a bearish continuation to become plausible, the market would need to resolve this consolidation with a decisive breakdown below the recent support established near 5.68, thereby signaling a resumption of the dominant downtrend.

Comparative Framework Verdict
In this week's AVAX technical analysis, the three strategic frameworks present a clear hierarchy of plausibility. The Range/Rebound scenario is the most relevant, though assessed as borderline, while both the Breakout and Continuation frameworks are deemed not plausible. The Range/Rebound framework best captures the current market state: a tense consolidation at a critical support level. It acknowledges the constructive signs, such as a potential higher low forming near the weekly Bollinger band, but correctly weighs them against the primary risk—an extremely powerful downtrend indicated by a daily ADX above 50. This internal conflict makes its borderline status an accurate reflection of market uncertainty. The Breakout framework is not plausible because the market is in a clear downtrend, not a pre-breakout compression phase. Similarly, the Continuation framework fails because the immediate price action is a sideways range, which contradicts the requirement for a stable directional flow, even if the macro trend is bearish. Resolution hinges on the boundaries defined by the Range/Rebound analysis. A daily close below the 5.95 USDC swing low would invalidate the basing attempt and signal a likely resumption of the downtrend. Conversely, for the rebound to gain credibility, it would need to achieve a daily close above the resistance zone of 6.67 - 6.99 USDC.
For broader market context, readers can also review the latest related fundamental analysis for this pair.
For live market monitoring and the full interactive chart, readers can access the dedicated AVAX Market Hub.
Disclaimer
CopyTradia provides technical analysis for informational and educational purposes only. This content does not constitute financial advice, investment recommendations, or trading signals. Cryptocurrency markets are highly volatile. Past performance is not indicative of future results. Always conduct your own research (DYOR) and consult a qualified financial advisor before making any investment decisions.


