AVAX Relative Strength Emerges Amidst Contracting Open Interest

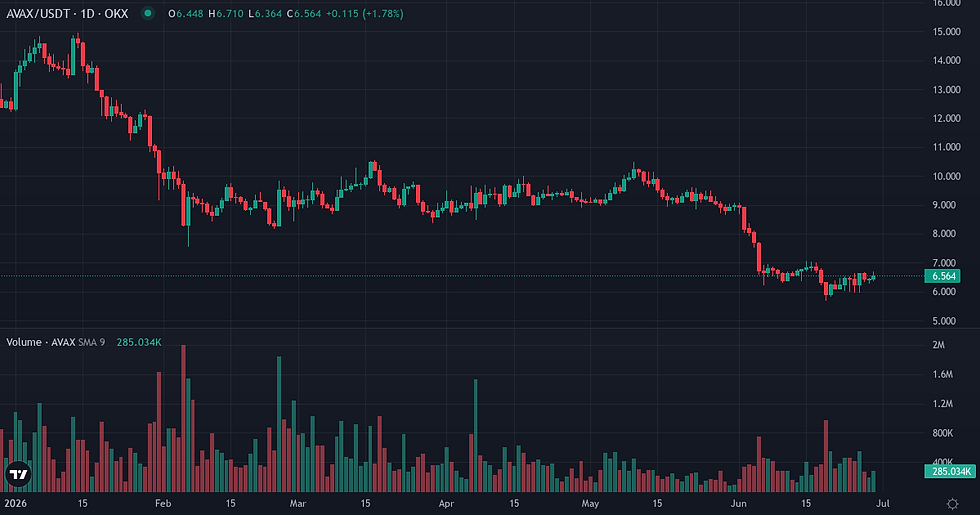
Avalanche (AVAX) concluded the week with a notable shift in its internal dynamics, exhibiting positive price action and a distinct improvement in AVAX relative strength against Bitcoin, despite a broader market characterized by extreme fear. This recent upward movement follows a significant monthly decline, creating a tension between short-term recovery and longer-term positioning adjustments.
Avalanche Price and Volatility Overview
Avalanche's spot price registered a 1.47% gain over the past seven days, contributing to a 3.37% increase in the last 24 hours, yet remaining down 26.80% over the 30-day period. This recent upward momentum contrasts with the preceding monthly trend. Realized volatility for the past seven days, at 63.72%, remained consistent with its 90-day baseline of 64.43%, indicating a stable level of price fluctuation. Against Bitcoin, AVAX demonstrated a 6.63% outperformance over the last week, pushing its ratio to 0.000106 from 0.000099. This recent strength, however, occurs within a longer 30-day period where AVAX underperformed Bitcoin by 10.32%. The asset maintains a structural distance of 95.51% from its all-time high.

Metric | Value |
AVAX Price | $6.53 (+3.37% 24h / +1.47% 7d / -26.80% 30d) |
Volume 24h | $252.9M |
Native Quote Vol. 24h | $1.1M |
Market Cap | $2.82B |
Market Cap Rank | 32 |
Circulating Supply | 431.77M AVAX |
ATH Distance | 95.51% below ATH |
Metric | Value |
AVAX/BTC Ratio | 0.000106 |
Relative Perf. 7d vs BTC | +6.63% |
Relative Perf. 30d vs BTC | -10.32% |
Derivatives Market: Open Interest Contraction
Speculative positioning in AVAX derivatives saw a contraction, with Open Interest declining by 12.85% over the past week to $0.054 billion, notably below its 90-day baseline of $0.073 billion. This suggests a reduction in overall leveraged exposure. Despite this contraction, the current funding rate of 0.008121% and a 30-day Z-score of 1.6860 indicate that existing leveraged positions have leaned positive, moving significantly above the 30-day average funding rate of -0.002526%. Liquidation data for the week revealed a dominant long-side pressure, with $17.8 million in long liquidations accounting for 84.7% of total liquidations, compared to $3.2 million in short liquidations. This 7-day skew towards long liquidations is more pronounced than the balanced 30-day average, where long liquidations represented 74.8%.
Metric | Value |
Funding Rate (current) | +0.0081% |
Funding Cumul. 7d | +0.0096% |
Open Interest | $0.05B (-12.85% 7d) |
Liq. 24h Longs | $0M |
Liq. 24h Shorts | $0M |
Liq. 7d Longs | $18M |
Liq. 7d Shorts | $3M |
Metric | Value |
Realized Vol 7d | +63.72% (90d avg: +64.43%) |
Realized Vol 30d | +77.43% |
Corr. BTC 30d | 0.7701 (90d avg: 0.8015) |
Beta vs BTC | 1.1650 |
Volume Momentum | 0.4307x |
Funding Z-Score 30d | 1.69σ |
Turnover Ratio | 0.0897 |
Liq. Intensity | 0.00744 |
Key Monitoring Conditions for AVAX
Monitoring conditions for the upcoming week include observing whether the recent AVAX relative strength against Bitcoin can sustain itself, particularly given the contracting Open Interest and the prevailing "Extreme Fear" sentiment across the broader crypto market. A second key dynamic will be the reaction of leveraged positioning to upcoming macro data, specifically the ADP Non-Farm Employment Change, ISM Manufacturing PMI, and Non-Farm Employment Change figures scheduled for July 1st and 2nd. Significant deviations from forecasts in these reports could introduce external volatility, potentially impacting the current positive funding rate and liquidation profile. Finally, tracking the evolution of long liquidation dominance will be crucial; a continued high proportion of long liquidations could signal persistent pressure on bullish leveraged bets, while a shift towards more balanced liquidations might indicate a stabilization of speculative interest.
Indicator | Value | Variation |
Broad Dollar Index | 120.40 | flat (7d) |
US 10Y Yield | 4.40% | -0.11pp (7d) |
Fed Balance Sheet | $6736B | -$779M (7d) |
M2 Money Supply | $23,052B | +$247.8B (1m) |
Fear & Greed | 12 (Extreme Fear) | -11 pts (7d) |
Fear & Greed Index: Alternative.me
Avalanche Weekly Takeaway
At week's close, Avalanche presents a nuanced internal regime characterized by a recent recovery in spot price and relative strength against Bitcoin, set against a backdrop of shrinking leveraged participation. The divergence between declining Open Interest and a positive shift in funding rates suggests a selective re-engagement of leveraged capital, or a reduction in short interest, rather than broad conviction. For swing traders, the current state implies a market attempting to find footing after a significant monthly downturn, with recent positive momentum needing to contend with a cautious derivatives landscape and an overarching environment of extreme market fear.
Disclaimer
This article provides a purely analytical perspective on Avalanche's market dynamics and should not be construed as investment advice or a recommendation to buy or sell any asset.


