SUI Range Rebound Analysis: Testing Resistance at 0.80 USDC
- CopyTradia Intelligence

- Jun 15
- 4 min read
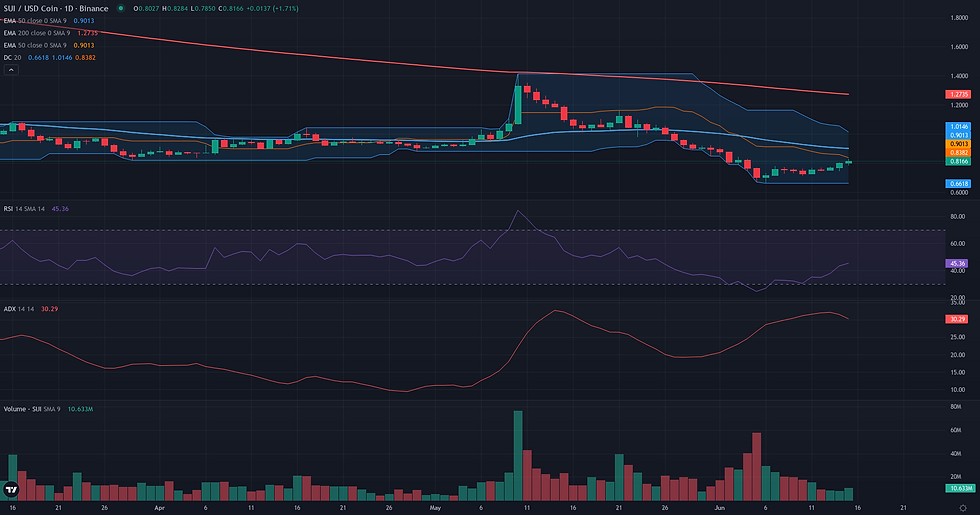
This SUI range rebound analysis examines the current SUI/USDC structure in the context of support defense and weakening alternative frameworks. SUI/USDC is currently at a critical technical juncture, testing the top of a newly formed consolidation range around the 0.80 USDC level. This stabilization follows a period of significant decline where support was established near 0.71 USDC. The broader market structure remains bearish, with the price trading well below key daily moving averages like the EMA 50 at 0.90 and the EMA 200 at 1.30. Momentum indicators reflect this tension; the daily RSI at 43.30 has yet to reclaim the neutral 50 mark, while the ADX at 31.53 indicates that the prior downtrend possessed considerable strength. This technical stabilization coincides with fundamental observations of easing volatility and an increase in derivatives open interest from a low baseline, suggesting a shift in market positioning after a prolonged decline. The current price action places the asset at a decision point, where the market must either confirm a nascent rebound or capitulate to the prevailing bearish trend.

SUI Range Rebound Analysis: Support and Friction Zones
Following the establishment of a plausible Range/Rebound framework, the resolution analysis for SUI/USDC focuses on the price action around the validation zone of [0.80, 0.82]. This zone, defined by the recent range high and the D1 middle Bollinger Band, is currently being tested. A successful rebound hinges on the market's ability to convert this area into support and build upward momentum. The invalidation for this framework is structurally anchored. A daily close below the consolidation low at 0.71 USDC would negate the rebound thesis, suggesting that the stabilization was merely a pause before another leg down. This level's importance is reinforced as it was the support found near the weekly lower Bollinger Band. Should the framework validate, the path forward is not without obstacles. An immediate friction zone exists at 0.83-0.84 USDC, a confluence of the W1 R1 and D1 R2 pivots. Overcoming this cluster is the first sign of confirmation. A more formidable barrier lies at 0.90 USDC, where the D1 EMA 50 acts as a significant structural resistance. This level will likely be a key test of the rebound's strength. If buyers maintain control, a logical technical projection points towards the 0.95-0.96 USDC area, a region of prior price congestion. Confirmation of the rebound would involve a sustained move above 0.82 USDC, while a weakening of the framework would be signaled by a rejection from this level and a fall back into the prior consolidation range, indicating that buying pressure is insufficient to fuel a breakout.


Breakout: Structural Catalyst Assessment
The current market structure for SUI/USDC does not support a plausible Breakout framework. While the price has recently stabilized in a narrow range around 0.71-0.80 after a precipitous fall, this behavior is more characteristic of a temporary pause within a dominant downtrend than a genuine preparation for a structural breakout. The broader technical context is overwhelmingly bearish; the price remains significantly below key daily and weekly moving averages, such as the D1 EMA 50 at 0.90 and the W1 EMA 50 at 1.63, which act as heavy overhead resistance. Critically, the required technical underpinnings for a breakout are absent. Momentum is weak, with the D1 RSI at 43.30, and the recent consolidation has occurred on declining volume, as shown by a Volume Oscillator of -38.50. For this framework to become relevant, the structure would need to evolve significantly, requiring a prolonged period of base-building and a clear recapture of key resistance levels with convincing momentum.
Continuation: Directional Flow Assessment
The technical structure for SUI/USDC presents a plausible case for a bearish continuation. The asset is situated within a well-defined downtrend on both daily and weekly timeframes, trading significantly below key structural moving averages such as the D1 EMA 50 at 0.90 and the W1 EMA 50 at 1.63. This long-term bearish context provides the foundational bias for the framework. The recent price action since the low of 0.66 appears to be a corrective pullback rather than a structural reversal. This interpretation is strongly supported by the D1 Volume Oscillator at -38.50%, which indicates that the rebound has occurred on diminishing volume, a classic sign of a weak counter-trend move. Furthermore, trend-following indicators remain aligned with the dominant flow; the D1 ADX at 31.53 confirms a trending environment, while the D1 RSI at 43.30 has failed to reclaim the neutral 50-level, suggesting bearish momentum persists. While the H1 micro-chart shows some short-term buying pressure, this activity is approaching potential resistance zones like the W1 R1 pivot at 0.83 and the 4H EMA 200 at 0.87, and does not yet challenge the broader daily and weekly bearish narrative.

Comparative Framework Verdict
The analysis of SUI/USDC reveals two conflicting but plausible technical frameworks, creating a state of analytical tension, while a third is deemed unlikely. The most compelling immediate scenario is the Range/Rebound framework, which is rated as plausible. It focuses on the recent structural stabilization above 0.71 USDC and the current test of the [0.80, 0.82] resistance zone. This view is supported by a notable decrease in selling volume during the consolidation and a bullish crossover on short-term momentum oscillators, suggesting bearish exhaustion. Contesting this view is the equally plausible bearish Continuation framework. This perspective interprets the recent bounce as a weak, corrective pullback within a powerful, established downtrend. It draws strength from the asset’s position far below major moving averages and a high ADX reading, suggesting the dominant trend remains in force. A daily close below 0.74 USDC would validate this bearish outlook. The Breakout framework is considered not plausible. The technical underpinnings for a major trend reversal, such as strong momentum and significant volume accumulation, are currently absent. The market's reaction at the immediate 0.80-0.82 resistance will be crucial in determining whether the rebound can gain traction or if the broader bearish context will reassert control.
For broader market context, readers can also review the latest related fundamental analysis for this pair.
For live market monitoring and the full interactive chart, readers can access the dedicated SUI Market Hub.
Disclaimer
CopyTradia provides technical analysis for informational and educational purposes only. This content does not constitute financial advice, investment recommendations, or trading signals. Cryptocurrency markets are highly volatile. Past performance is not indicative of future results. Always conduct your own research (DYOR) and consult a qualified financial advisor before making any investment decisions.


