SUI Range Rebound Analysis: Support Holds at $0.65

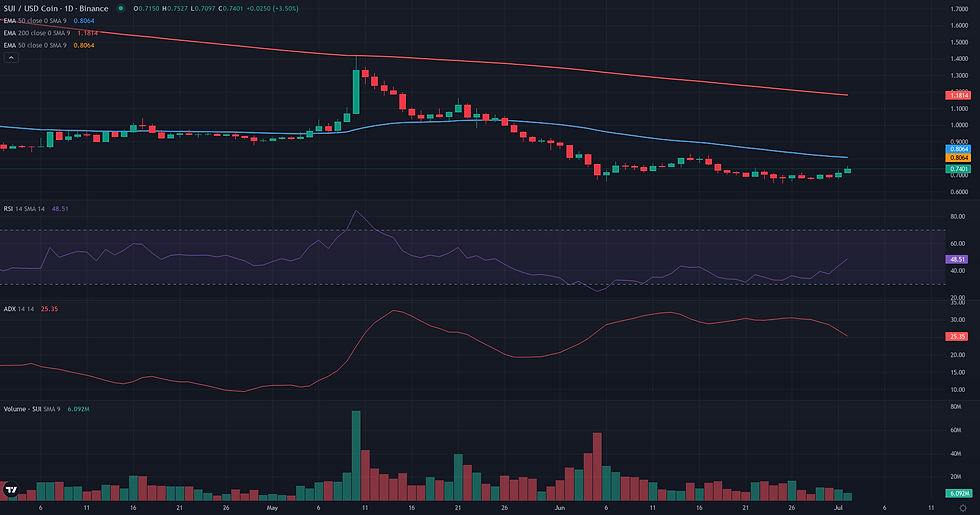
This SUI range rebound analysis examines the current SUI/USDC structure in the context of support defense and weakening alternative frameworks. SUI/USDC is navigating a critical juncture after a prolonged downtrend, with price action now consolidating within a narrow weekly range between approximately $0.65 and $0.74. The market's structure remains bearish on a macro level, as evidenced by the price trading significantly below its 50-day ($0.81) and 200-day ($1.20) exponential moving averages. Current momentum indicators reflect this state of indecision; the daily RSI sits at a subdued 43.33, failing to show definitive bullish strength, while the ADX at 26.97 suggests the prior bearish trend still exerts some influence. This technical consolidation occurs against a fundamental backdrop of divergent signals, with the market showing some relative strength despite a significant monthly price decline. The current equilibrium presents a technical crossroads, where the market must resolve whether the recent support will serve as a base for a recovery or merely a pause before the next leg down.

SUI Range Rebound Analysis: Support and Friction Zones
The Range/Rebound framework for SUI/USDC is at a critical juncture, with price action directly testing the validation zone defined between 0.72 and 0.74. The resolution of this framework depends on whether this resistance can be decisively overcome and converted into support. The entire rebound hypothesis is predicated on the defense of the 0.64-0.65 support confluence, which aligns with recent daily and weekly lows. A daily close below this foundational support would invalidate the scenario, signaling a likely continuation of the prior downtrend. Should the breakout above 0.74 be successful, the path forward is not without obstacles. The first friction zone is located around 0.76-0.79, an area defined by the D1 R2 and W1 R2 pivots. Beyond this, a more significant test awaits at the D1 EMA 50, currently near 0.81. This moving average represents the first major structural resistance and serves as a primary projection zone for a successful rebound within the broader bearish context. A more optimistic projection could target the 0.88-0.90 zone, a previous support level that may now act as resistance. Confirmation of the rebound's strength would involve a sustained hold above 0.74, transforming it into a new support floor, and a push through the 0.76 pivot. Conversely, a weakening of the framework would be indicated by a rejection from the current resistance, with price failing to hold its gains and falling back below 0.72, suggesting the rebound attempt lacks sufficient momentum.


Breakout: Structural Catalyst Assessment
The Breakout framework is assessed as not plausible for SUI/USDC at this time. The market structure does not exhibit the necessary characteristics of a pre-breakout consolidation. While a clear resistance zone has formed between 0.80 and 0.83, evidenced by the D1 Donchian Upper (0.83) and the D1 EMA 50 (0.81), the current price action is not challenging this ceiling. Instead, the price is hovering around 0.72, which corresponds to the D1 Bollinger middle band, indicating a state of equilibrium or bearish continuation rather than bullish compression. The internal dynamics reinforce this reading; momentum is weak with the D1 RSI at 43.33, well below the neutral 50 mark, and the D1 Volume Oscillator is significantly negative at -21.11, signaling a distinct lack of buying pressure. Critically, the weekly timeframe provides a strongly bearish context, with the price trading far below key long-term averages like the W1 EMA 50 (1.56). This suggests any potential upward move on the daily chart would be a counter-trend rally with a low probability of sustained follow-through. For this framework to become relevant, the structure would need to fundamentally change, requiring price to reclaim the 0.80-0.83 resistance zone with a concurrent and decisive increase in both momentum and volume.

Continuation: Directional Flow Assessment
The Continuation framework for SUI/USDC is currently assessed as borderline due to a clear tension between the dominant, long-term bearish structure and the recent short-term price action. On one hand, the weekly and daily charts establish an unambiguous downtrend, with price trading well below key structural moving averages such as the D1 EMA 50 at 0.81 and the D1 EMA 200 at 1.20. The D1 ADX at 26.97 confirms that a trend is in place. This context provides a solid foundation for a potential bearish continuation. However, this reading is challenged by the price action of the past week. Instead of a stable directional flow, the market has entered a consolidation phase, oscillating between the weekly low of 0.65 and the weekly high of 0.74. This pause has interrupted the bearish momentum, and the current price is testing local resistance around the Weekly R1 (0.73). The lack of immediate follow-through to the downside and the presence of short-term bullishness, evidenced by the H1 RSI at 64.24, create a state of structural indecision. Therefore, while the overarching trend favors a bearish continuation, the current lack of directional clarity on the daily timeframe makes the framework borderline, pending a resolution out of the current range.
Comparative Framework Verdict
Comparing the three strategic frameworks, the Range/Rebound scenario emerges as the most plausible technical interpretation. This view is supported by the market's clear defense of a robust support confluence between $0.64 and $0.65 and the subsequent horizontal price action, which is characteristic of a range formation. Price is currently testing the upper boundary of this consolidation near $0.72-$0.74, and a sustained break above this zone would validate the rebound thesis. The Continuation framework is rated as borderline. While it correctly acknowledges the dominant daily and weekly bearish trend, its immediate applicability is weakened by the recent stall in downward momentum. The market has paused its descent, creating a consolidation that interrupts the directional flow required for a high-probability continuation. This framework would only regain prominence if the price decisively breaks below local support, particularly the weekly pivot at $0.69. Finally, the Breakout framework is considered not plausible. The necessary preconditions, such as price compression below a key resistance level and building bullish momentum, are absent. The focus, therefore, remains on the resolution of the current range, which will determine whether a rebound is underway or if the overarching bearish trend is set to resume.
For broader market context, readers can also review the latest related fundamental analysis for this pair.
For live market monitoring and the full interactive chart, readers can access the dedicated SUI Market Hub.
Disclaimer
CopyTradia provides technical analysis for informational and educational purposes only. This content does not constitute financial advice, investment recommendations, or trading signals. Cryptocurrency markets are highly volatile. Past performance is not indicative of future results. Always conduct your own research (DYOR) and consult a qualified financial advisor before making any investment decisions.


