SUI Consolidation Analysis: Bearish Trend vs. Rebound Potential
- CopyTradia Intelligence

- Jun 18
- 4 min read
This SUI consolidation analysis examines the current SUI/USDC structure in the context of support defense and weakening alternative frameworks. SUI/USDC is currently navigating a phase of tight consolidation following a significant downtrend, with price action largely contained between 0.71 and 0.80 over the past two weeks. The daily close at 0.77 places the asset in a state of equilibrium, yet the broader technical context remains bearish. The price is trading substantially below key moving averages like the 50-day EMA at 0.89, while momentum, measured by the daily RSI at 39.11, remains weak. However, the ADX at 28.84 suggests the underlying trend retains directional strength, implying this consolidation may be a temporary pause rather than a definitive reversal. This technical consolidation aligns with recent fundamental analysis pointing to easing volatility, even as derivatives activity suggests evolving positioning dynamics within the broader downtrend. The current market structure presents a critical juncture, with opposing technical frameworks exploring the potential for either a continuation of the sell-off or a counter-trend rebound from current support levels.

Range & Rebound Resolution: Support and Friction Zones
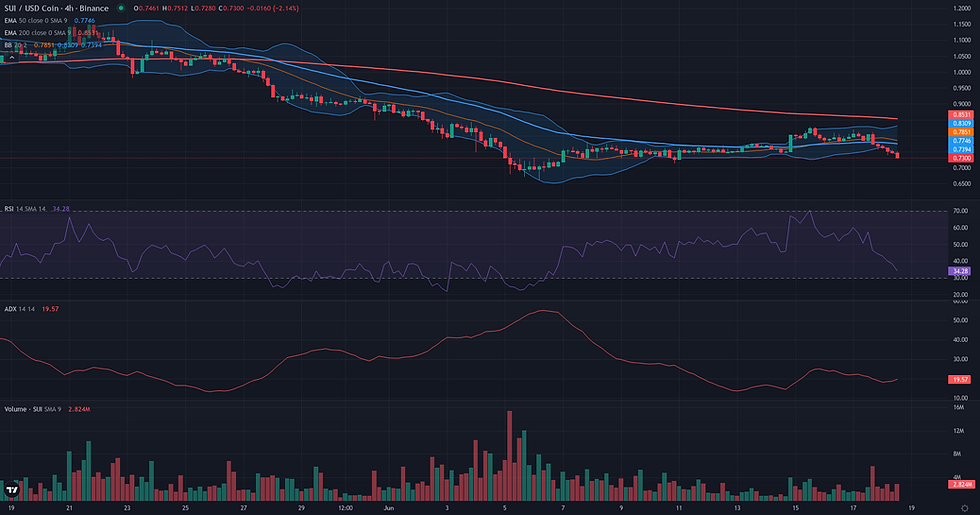
The resolution for the SUI/USDC range rebound framework is contingent on a daily close above the 0.80-0.83 USDC resistance area. This zone, which aligns with the Weekly R1 pivot (0.83), represents the ceiling of the recent consolidation. However, the immediate context on the 4H chart suggests the rebound attempt is struggling, with the RSI (38.35) indicating weak momentum after a recent rejection from these highs. The framework would be invalidated if the price breaks the floor of the consolidation. A daily close below the structural low at 0.66 USDC would negate the stabilization narrative and signal a probable continuation of the prevailing downtrend. Should the rebound validate, it would face several friction zones. The first obstacle is the Weekly R2 pivot at 0.86, followed by a more significant barrier at the D1 50-period EMA, currently near 0.89. This moving average is a key dynamic resistance in the bearish structure. A further layer of friction exists at the 0.95-0.98 level, a prior support/resistance zone. If these levels are cleared, technical projections point towards the mid-May resistance cluster around 1.07-1.11. Confirmation of the rebound's strength would involve not just breaking above 0.83 but successfully retesting this area as support. Conversely, a clear weakening sign would be a failure to hold the 0.74-0.75 support zone (D1 S1), which would likely lead to a retest of the range lows and suggest sellers are regaining control.

Breakout: Structural Catalyst Assessment
The Breakout framework is currently not plausible for SUI/USDC. The market structure does not exhibit the necessary characteristics of pre-breakout compression. Instead of consolidating beneath a well-defined resistance, the price is in a low-level consolidation range after a significant decline from above 1.10 to a low of 0.66. This price action is more indicative of a pause in a downtrend or a potential bottoming process rather than a buildup of energy for an upward break. The broader context reinforces this reading: the price is trading well below key long-term moving averages such as the D1 EMA 50 at 0.89 and the D1 EMA 200 at 1.29, confirming a bearish regime. Momentum indicators are weak, with the D1 RSI at 39.11, reflecting a lack of buying pressure. Furthermore, the D1 Volume Oscillator at -26.69 shows that volume is contracting, which in this context suggests disinterest rather than stealth accumulation. For this framework to become relevant, the structure would need to fundamentally change, starting with the formation of a credible resistance level followed by a period of sustained compression beneath it, supported by a clear shift in momentum.

SUI Consolidation Analysis: Directional Flow Assessment
The technical structure for SUI/USDC is defined by a well-established bearish trend on both daily and weekly timeframes. Price is currently positioned significantly below key dynamic references such as the Daily EMA 50 at 0.89, confirming the control of sellers. Following a sharp downward impulse that established a low near 0.66, the market has entered a consolidation phase characterized by reduced volatility and lower volume, as indicated by a Volume Oscillator of -26.69. This type of pause is consistent with a potential continuation of the primary trend. Momentum indicators support this view, with the Daily RSI at 39.11 reflecting bearish sentiment without being in an oversold condition that might suggest imminent exhaustion. The ADX on both daily (28.84) and weekly (28.86) charts confirms that the market remains in a directional, trending environment. Therefore, the bearish Continuation framework is deemed plausible, as the current structure is interpreted as a temporary equilibrium before a potential resumption of the dominant downward flow.

Comparative Framework Verdict
Comparing the three technical frameworks for SUI/USDC reveals a market at a clear inflection point, caught between two plausible but opposing scenarios. The Breakout framework is deemed not plausible, as the current structure is a low-level consolidation following a sharp price drop, lacking the necessary compression beneath a key resistance level required for an explosive upward move. The primary conflict is between the bearish Continuation and the counter-trend Range/Rebound frameworks, both of which are assessed as plausible. The Continuation framework holds a slight edge as the dominant interpretation. It aligns with the powerful, established downtrend on both daily and weekly charts, viewing the current 0.71-0.80 range as a temporary pause before sellers potentially resume control. This view is supported by weak RSI readings and a trending ADX. Conversely, the Range/Rebound framework presents a credible secondary scenario. It focuses on the immediate price action: a clear twelve-day stabilization above a support confluence near 0.71. While plausible, this framework is weakened by the lack of strong bullish momentum and the formidable overhead resistance from the broader bearish trend. The market's next directional move will likely be determined by how price resolves this consolidation range, with a break below support favouring the Continuation thesis and a sustained move above resistance lending credence to the Rebound.
For broader market context, readers can also review the latest related fundamental analysis for this pair.
For live market monitoring and the full interactive chart, readers can access the dedicated SUI Market Hub.
Disclaimer
CopyTradia provides technical analysis for informational and educational purposes only. This content does not constitute financial advice, investment recommendations, or trading signals. Cryptocurrency markets are highly volatile. Past performance is not indicative of future results. Always conduct your own research (DYOR) and consult a qualified financial advisor before making any investment decisions.


