Solana Range Rebound Analysis: Price Stabilizes Above $60
- CopyTradia Intelligence

- Jun 15
- 5 min read
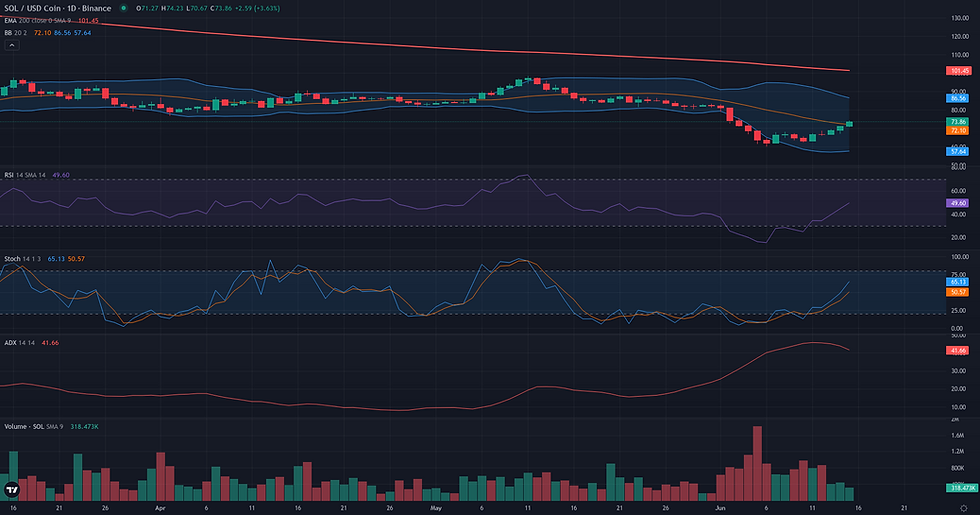
This Solana range rebound analysis examines the current SOL/USDC structure in the context of support defense and weakening alternative frameworks. SOL/USDC is currently navigating a critical juncture, attempting to establish a convincing recovery after finding structural support near $60.13. The price closed the week at its high of $71.27, suggesting buying pressure is returning, but the broader technical context remains challenging. Momentum, as measured by the D1 RSI at 44.56, has yet to cross into bullish territory, while the high D1 ADX of 43.84 underscores the lingering influence of the preceding sharp downtrend. Price action remains firmly below key long-term averages like the D1 EMA 50 at $78.46, defining the current move as a counter-trend bounce. This technical rebound occurs within a complex speculative environment, as highlighted by fundamental analysis showing increased leveraged participation alongside negative funding rates, suggesting the recovery may be fragile. The market is therefore caught between short-term stabilization signals and a dominant bearish macro structure, setting the stage for the strategic frameworks below.

Solana Range Rebound Analysis: Support and Friction Zones
Starting from the validation zone, which required a sustained hold above the weekly pivot W1 S1 at 65.29, the SOL/USDC rebound framework is currently in an active resolution phase. The price has successfully cleared this area and is now confronting its first layer of significant resistance, defining the immediate path for confirmation or rejection. The structural integrity of this rebound is anchored by the recent absolute low at 60.13. A daily close below this level would represent a complete invalidation of the framework, signaling a resumption of the dominant downtrend. A more immediate warning sign would be a price breakdown below the recent weekly low of 62.30, as this would break the series of higher lows that underpins the current recovery attempt. The path higher is not without obstacles. Immediate friction is located at the D1 R1 pivot of 72.72, a level currently being tested. The overbought 4H RSI (73.53) suggests this zone could induce a pause or a minor pullback. Should the price overcome this, a more formidable resistance cluster awaits between 74.16 (D1 R2) and 74.26 (W1 R1). The most significant structural friction zone, however, is the D1 EMA 50 at 78.46, which often acts as a ceiling for counter-trend bounces. If the rebound successfully navigates these friction zones, the D1 EMA 50 at 78.46 stands as the primary technical projection. Confirmation of the rebound's strength would be a clear daily close above the 74.26 pivot resistance. Conversely, a rejection from the current levels followed by a drop below the daily pivot at 69.82 would be a clear sign of weakening momentum.

Breakout: Structural Catalyst Assessment
The Breakout framework is assessed as not plausible for SOL/USDC at this time. The current market structure does not exhibit the necessary characteristics of a pre-breakout compression. Instead of consolidating beneath a clear resistance, the price is in a recovery phase following a significant decline from the mid-80s to a low near 60.13. This price action is fundamentally a counter-trend bounce within a well-established downtrend, confirmed by the price trading below key long-term moving averages such as the D1 EMA 200 (103.00) and the W1 EMA 50 (118.65). The recovery itself shows signs of weakness; the D1 RSI at 44.56 remains below the neutral 50 threshold, indicating a lack of bullish momentum, and the negative Volume Oscillator (-9.68) suggests this upward move is not supported by strong market participation. For this framework to become relevant, the structure would need to shift from a simple bounce to a prolonged period of consolidation, allowing energy to build below a key resistance level like the recent range high around 86.07.

Continuation: Directional Flow Assessment
The Continuation framework is assessed as not plausible for SOL/USDC at this time. While the recent price action shows a sharp, bullish recovery from the 60.13 low to above 71.00, this move is structurally a counter-trend bounce rather than a continuation of an established directional flow. The broader context on both the daily and weekly charts remains decidedly bearish, with price trading significantly below key trend-defining moving averages such as the D1 EMA50 at 78.46 and the W1 EMA50 at 118.65. The high D1 ADX reading of 43.84 confirms the strength of the preceding downtrend, not the nascent recovery. Furthermore, the D1 RSI at 44.56 remains in bearish territory, highlighting a disconnect with the short-term bullishness seen on the H1 timeframe. For a Continuation framework to become relevant, the market would first need to establish a new directional structure, likely by forming a series of higher lows and reclaiming significant resistance levels like the D1 EMA50.

Comparative Framework Verdict
In assessing the three strategic frameworks for SOL/USDC, a clear hierarchy emerges from the current technical structure. The Range/Rebound framework stands out as the only plausible scenario. It accurately captures the market's recent behavior: a sharp capitulation to a low of $60.13 followed by a period of stabilization and a bounce, validated by the weekly price closing back inside its Bollinger Bands. This framework correctly identifies the current price action as a mean-reversion attempt within a broader downtrend, with its primary projection targeting the D1 EMA 50 around $78.46. Conversely, both the Breakout and Continuation frameworks were assessed as not plausible. Their logic is inconsistent with the prevailing market conditions. The Breakout framework is invalid because the price is not in a compression phase below a key resistance; it is in a recovery phase from a significant low. Similarly, the Continuation framework fails because the recent bullish move is a counter-trend bounce, not the continuation of an established uptrend. The dominant daily and weekly trends remain bearish, a fact that both of these frameworks overlook. Therefore, the most coherent interpretation of the current structure is a counter-trend rebound. The key question for the week ahead is whether this bounce has enough strength to challenge significant resistance zones, particularly the pivot cluster around $74.26, or if it will falter under the pressure of the overarching bearish trend.
For broader market context, readers can also review the latest related fundamental analysis for this pair.
For live market monitoring and the full interactive chart, readers can access the dedicated SOL Market Hub.
Disclaimer
CopyTradia provides technical analysis for informational and educational purposes only. This content does not constitute financial advice, investment recommendations, or trading signals. Cryptocurrency markets are highly volatile. Past performance is not indicative of future results. Always conduct your own research (DYOR) and consult a qualified financial advisor before making any investment decisions.


