SOL Range Rebound Analysis: Stalling at Resistance
- CopyTradia Intelligence

- Jun 18
- 4 min read
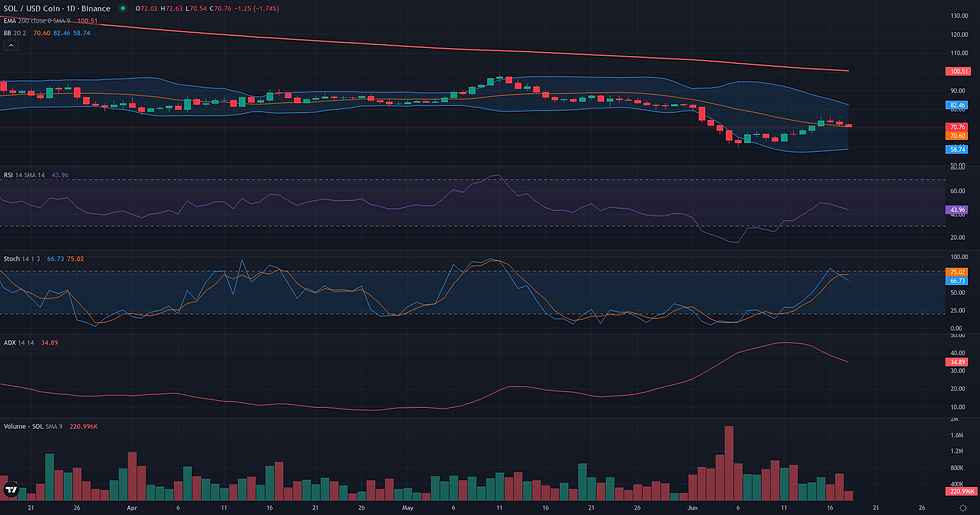
This SOL range rebound analysis examines the current SOL/USDC structure in the context of support defense and weakening alternative frameworks. This week's SOL technical analysis reveals a market in a state of consolidation following a significant price decline. With a daily close at 72.01 USDC, SOL/USDC is trading within a defined range, capped by resistance near 76.00 and supported by lows around the 60.00-62.00 area. The current price is situated below key bearish structural references, including the daily 50-period EMA at 77.86. Momentum indicators reflect this indecision; the daily RSI at 46.19 remains below the neutral 50 mark, while the high ADX reading of 36.63 underscores the lingering strength of the preceding downtrend. This technical consolidation aligns with recent fundamental analysis describing a complex speculative environment, where a spot price rebound is met with negative funding rates and signs of underlying market tension. The current price action represents a pause, setting the stage for a potential resolution through either a confirmed rebound or a resumption of the broader bearish trend.

SOL Range Rebound Analysis: Support and Friction Zones
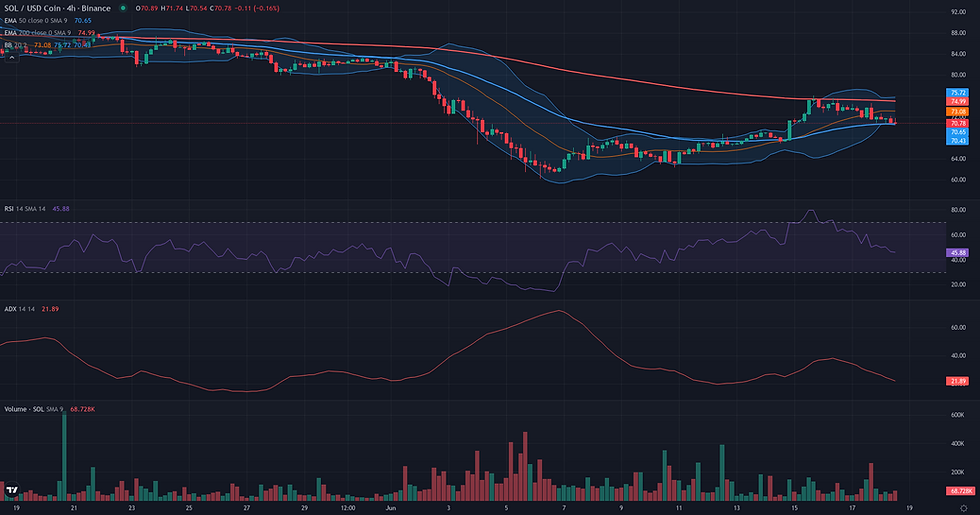
The resolution of the Range/Rebound framework for SOL/USDC is contingent on a daily close above the 76.06 USDC high, which currently caps the consolidation range. While the rebound from the 60.13 low is structurally sound on the weekly chart, the 4H resolution timeframe reveals signs of exhaustion. Momentum has cooled, with the 4H RSI (46.38) below the neutral 50 mark, and the price has pulled back from its recent peak, indicating that sellers are defending the top of the range. The framework would lose its technical coherence if the price were to break its recent upward structure, with a daily close below the 62.30 low serving as a clear invalidation point, suggesting the rebound has failed. Should buyers manage to push past the 76.06 validation level, they will immediately encounter a dense friction zone between 76.06 and 77.86. This area is reinforced by multiple technical obstacles, including the W1 R2 pivot (77.25) and the D1 EMA 50 (77.86), making it a critical test of the rebound's strength. A decisive break above this cluster would confirm buyer control, opening a path toward higher projection zones, initially targeting the 89.00-90.10 structural resistance from early May, and later, the D1 EMA 200 at 102.92. Conversely, a failure to hold support around the D1 S1 pivot at 70.31 would be a significant weakening signal.
Breakout: Structural Catalyst Assessment
The Breakout framework is currently not plausible for SOL/USDC. The market structure does not exhibit the necessary preparation for a structural break. While a clear resistance zone has been established between the weekly R1 pivot at 74.26 and the daily EMA 50 at 77.86, the price action shows a rejection from this area rather than compression beneath it. The recent high of 76.06 was followed by a retreat, which is contrary to the coiling action typical of a breakout setup. This structural weakness is confirmed by underlying indicators. Daily momentum is lacking, with the RSI at 46.19, and the Volume Oscillator's negative reading of -11.56 suggests that the recent relief rally lacked conviction. Furthermore, the weekly context remains strongly bearish, with the W1 RSI at 34.62, framing the recent daily price action as a counter-trend move. For the Breakout framework to become relevant, the price would need to re-challenge and consolidate tightly below the 77.86 resistance level, supported by a clear uptick in momentum and volume.

Continuation: Directional Flow Assessment
The Continuation framework is assessed as not plausible for SOL/USDC at this time. While the daily chart shows a notable recovery from the early June low of 61.45 to a recent high of 76.06, this rally exists within a dominant and structurally intact bearish trend on both daily and weekly timeframes. The price remains firmly below key long-term averages, including the D1 EMA50 at 77.86 and the W1 EMA50 at 118.65, which act as significant structural resistance. The recovery itself shows corrective characteristics rather than the beginning of a stable directional flow; daily momentum, measured by the D1 RSI at 46.19, has failed to reclaim bullish territory, and the negative Volume Oscillator (-11.56) suggests a lack of conviction behind the move. The current price action shows a stall and pullback from the 76.06 high, reinforcing the view that the path of least resistance remains aligned with the broader downtrend. For a continuation scenario to become relevant, the market would first need to invalidate the bearish structure by establishing a clear pattern of higher highs and higher lows above key resistance levels.

Comparative Framework Verdict
Among the three frameworks analyzed, the Range/Rebound scenario is the only one deemed plausible in the current market structure. This framework accurately captures the transition from a sharp downtrend into a multi-day consolidation phase, where price has found support at a significant weekly structural zone and is now attempting a recovery. The rebound's coherence is supported by the rejection of lower prices and a short-term shift in momentum, but it remains a counter-trend move within a strong, established bearish context. Conversely, both the Breakout and Continuation frameworks are assessed as not plausible. The Breakout scenario lacks the necessary structural compression below resistance; instead, the price has shown rejection from the upper part of the range. The Continuation framework is invalidated by the dominant bearish trend across both daily and weekly timeframes, with price action appearing corrective rather than indicative of a new, stable uptrend. Weak momentum, confirmed by a sub-50 RSI and negative volume oscillator, undermines both of these bullish theses. The resolution for the market now centers on the Range/Rebound framework. Its validation hinges on the price securing a daily close above the range high at 76.06. A failure to do so, particularly a break below the recent structural low of 62.30, would invalidate the rebound and suggest the underlying bearish pressure is reasserting control.
For broader market context, readers can also review the latest related fundamental analysis for this pair.
For live market monitoring and the full interactive chart, readers can access the dedicated SOL Market Hub.
Disclaimer
CopyTradia provides technical analysis for informational and educational purposes only. This content does not constitute financial advice, investment recommendations, or trading signals. Cryptocurrency markets are highly volatile. Past performance is not indicative of future results. Always conduct your own research (DYOR) and consult a qualified financial advisor before making any investment decisions.


