SEI/USDC Range Rebound: Daily Consolidation vs. Weekly Bearish Pressure
- CopyTradia Intelligence

- Jun 18
- 5 min read
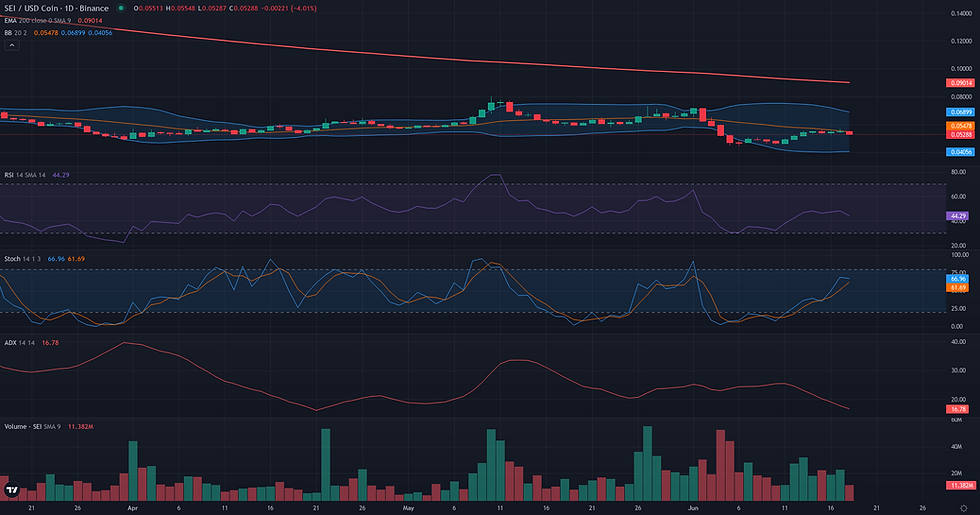
This SEI/USDC range rebound examines the current SEI/USDC structure in the context of support defense and weakening alternative frameworks. The SEI/USDC pair is currently defined by a state of technical equilibrium on the daily timeframe, with price action locked in a tight consolidation range between approximately 0.05 and 0.06. This period of indecision is quantitatively confirmed by a very low D1 ADX of 17.82, indicating a non-trending market, while the D1 RSI sits at a neutral 48.04, reflecting a balance between buyers and sellers. However, this daily pause occurs within the context of a powerful, established weekly downtrend, evidenced by a high W1 ADX of 37.86 and the price trading significantly below long-term moving averages like the W1 EMA 50. This technical stalemate, where daily consolidation meets weekly bearish pressure, aligns with recent fundamental observations of a cautious market where short-term spot price increases have been met with contracting derivatives interest and an 'Extreme Fear' sentiment. The following analysis will explore the three primary technical frameworks—Range/Rebound, Breakout, and Continuation—to assess how this tension might resolve.

SEI/USDC Range Rebound: Support and Friction Zones
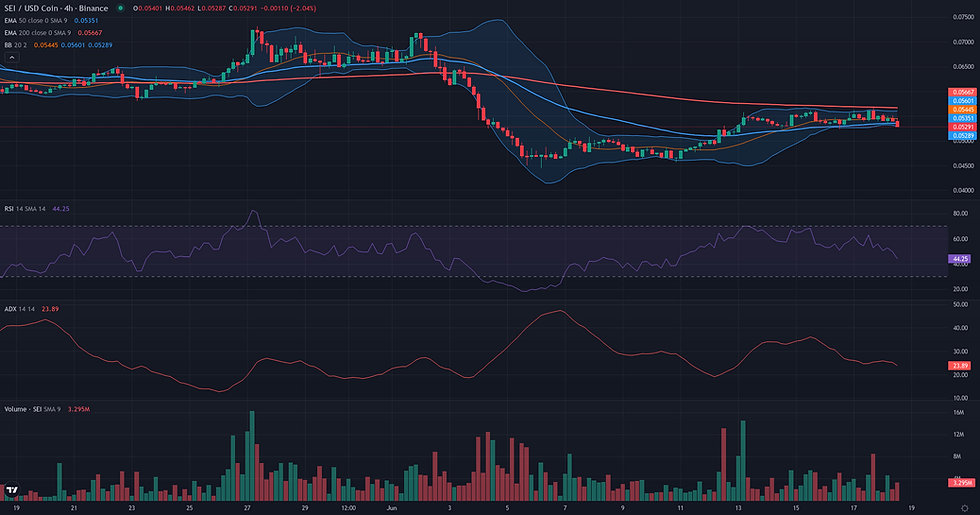
The resolution of the Range/Rebound framework for SEI/USDC hinges on the price breaking out of its tight consolidation range defined by the 0.05 support and 0.06 resistance. The validation condition, a daily close above 0.06, remains the critical hurdle for any bullish scenario to unfold. Conversely, the framework would be invalidated by a daily close below the 0.05 support cluster. This level, reinforced by daily and weekly pivots, forms the floor of the current range. A breach would signify a failure of the rebound attempt and a likely resumption of the dominant weekly downtrend, which remains a significant contextual pressure. Should the framework validate by breaking above 0.06, the first significant friction zone lies between 0.07 and 0.08. This area corresponds to the swing highs from May and represents a key structural resistance where sellers previously took control. A more optimistic technical projection points towards the D1 EMA 200, currently at 0.09, which serves as a major long-term reference. Confirmation of the rebound requires sustained price action above 0.06, while weakening would be evidenced by continued rejections from this ceiling, as seen in recent 4H price action. The current technical picture is one of indecision, but a rising 4H ADX (25.20) suggests energy is building for a potential breakout.
Breakout: Structural Catalyst Assessment
The daily chart for SEI/USDC presents a structure of consolidation, a typical prerequisite for a potential breakout scenario. Price action has established a clear resistance ceiling around the 0.07 level, which corresponds to the upper Donchian channel and recent swing highs. However, despite this structural setup, the Breakout framework is deemed not plausible at this time due to a significant lack of supporting technical evidence and strong multi-timeframe contradictions. Firstly, the dynamic forces required to fuel a breakout are absent. Daily momentum is neutral, with the RSI at 48.04, and the ADX at a low 17.82 confirms a lack of any directional pressure. Compounding this, the Volume Oscillator (-5.00) indicates that recent price action has occurred on below-average volume, suggesting a lack of conviction from buyers. Most critically, the weekly context is decidedly bearish. The price is trading deep within a strong, established downtrend, confirmed by a high weekly ADX of 37.86. Attempting a bullish breakout in such an environment carries a high risk of failure, as it would be a direct move against the dominant market current. For a breakout to become plausible, the market would need to demonstrate a fundamental shift, including a sustained push above 0.07 accompanied by a significant expansion in both volume and momentum.

Continuation: Directional Flow Assessment
The Continuation framework is currently not plausible for SEI/USDC due to a clear disconnect between the weekly context and the daily market structure. While the weekly chart displays a strong, established downtrend with price trading significantly below key moving averages like the W1 EMA 50 (0.14), the daily timeframe has failed to perpetuate this momentum. Instead, the D1 chart shows a market that has entered a distinct consolidation phase over the past two weeks, oscillating within a tight range between support around 0.05 and resistance at 0.06. This lack of directional movement is quantitatively confirmed by a very low D1 ADX of 17.82, indicating a non-trending environment. Furthermore, the D1 RSI is neutral at 48.04, signaling an absence of momentum. The price is currently pinned at the 0.06 level, a significant confluence of resistance that includes the D1 EMA 50 and the Weekly R1 pivot. This price action reflects equilibrium and indecision, not the stable directional flow required by the Continuation framework. For this framework to become relevant, the market would need to resolve this range with a decisive breakout, either below 0.05 to resume the bearish trend or above 0.06 to challenge it.

Comparative Framework Verdict
Comparing the three technical frameworks reveals a market structure that strongly favors one scenario while invalidating the others. The Range/Rebound framework emerges as the most relevant, albeit with a 'borderline' plausibility. It accurately captures the current market state: a clear consolidation on the daily chart, supported by a low ADX, which is forming above a support confluence around 0.05. The primary weakness, and the reason for its borderline status, is the powerful weekly downtrend that exerts significant bearish pressure, creating a high-risk environment for any potential rebound. The validation for this framework hinges on the price achieving a daily close above the 0.06 resistance level. In contrast, both the Breakout and Continuation frameworks are deemed 'not plausible'. Their core requirement is a trending market on the daily timeframe, a condition that is fundamentally absent. The D1 ADX reading below 20 confirms a lack of directional strength, rendering any immediate breakout or trend continuation scenario technically unsupported. The market is in a state of equilibrium, not a directional flow. Therefore, the analysis points towards the resolution of the current range as the key driver for the next significant move. A failure to hold the 0.05 support would likely signal a resumption of the macro downtrend, whereas a sustained break above 0.06 is necessary to lend credibility to the rebound thesis.
For broader market context, readers can also review the latest related fundamental analysis for this pair.
For live market monitoring and the full interactive chart, readers can access the dedicated SEI Market Hub.
Disclaimer
CopyTradia provides technical analysis for informational and educational purposes only. This content does not constitute financial advice, investment recommendations, or trading signals. Cryptocurrency markets are highly volatile. Past performance is not indicative of future results. Always conduct your own research (DYOR) and consult a qualified financial advisor before making any investment decisions.


