SEI/USDC Range Rebound: Support Holds at $0.05

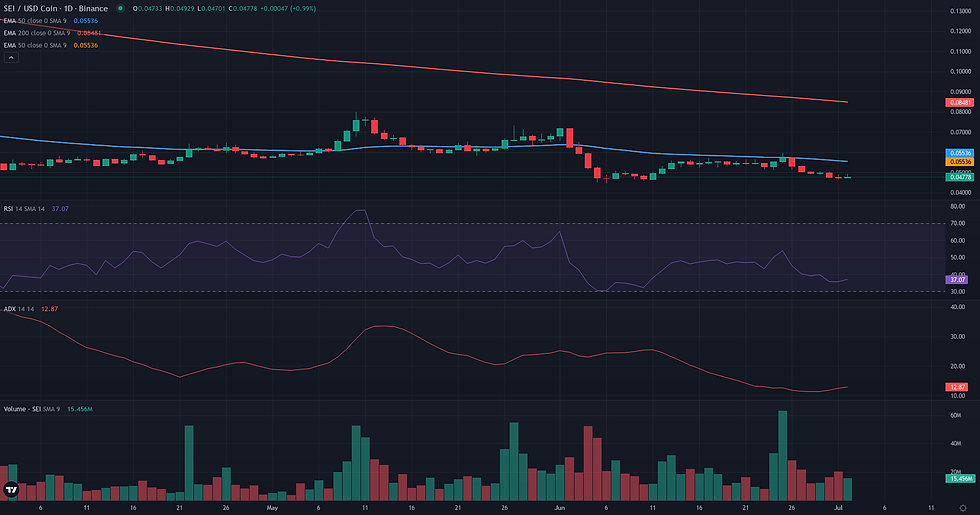
This SEI/USDC range rebound examines the current SEI/USDC structure in the context of support defense and weakening alternative frameworks. SEI/USDC is currently defined by a state of pronounced market indecision, with price action tightly compressed within a narrow consolidation range. For the past month, the price has oscillated between key support at 0.05 and resistance at 0.06, reflecting a clear equilibrium between buyers and sellers. This sideways movement is quantitatively confirmed by the daily ADX, which sits at an extremely low 12.43, signaling a distinct lack of any directional trend. While the daily RSI at 35.66 remains in bearish territory, it has not yet signaled a definitive breakdown. This technical stalemate has formed within a broader bearish context, with the price trading significantly below its 200-day EMA of 0.09. This technical picture aligns with recent fundamental analysis, which describes a tension between the prevailing bearish price action and speculative interest holding key support levels. The following analysis will explore three technical frameworks to assess how this low-volatility structure might resolve.

SEI/USDC Range Rebound: Support and Friction Zones
Following the identification of a plausible Range/Rebound framework, the resolution analysis focuses on the key levels defining its potential success or failure. The validation for this scenario remains anchored to a sustained hold of the critical 0.05 USDC support zone. This level represents a confluence of the daily range low and the weekly S1 pivot, forming the foundation of the rebound thesis. The invalidation of this framework is therefore clearly defined: a daily close below 0.05 USDC would breach this support structure, negate the rebound potential, and likely signal a continuation of the preceding downtrend towards prior lows around 0.04 USDC. For the rebound to materialize, it must first overcome the current state of inertia visible on the 4H chart. The primary obstacle, or friction zone, lies at the range's upper boundary of 0.06 USDC. This ceiling is technically significant, reinforced by the D1 EMA 50 and the weekly R1 pivot, both at 0.06 USDC. A rejection from this level would keep the price contained and weaken the rebound case. Conversely, a decisive break above this resistance would serve as a strong confirmation. If the framework confirms, the initial projection is the 0.06 USDC resistance itself. A more ambitious projection, following a structural breakout, would be the D1 EMA 200 at 0.09 USDC, a key long-term average. The framework's coherence currently depends on its ability to generate upward momentum from the 0.05 USDC floor and challenge the formidable 0.06 USDC ceiling.


Breakout: Structural Catalyst Assessment
The Breakout framework is currently not plausible for SEI/USDC despite the presence of a visually compelling consolidation pattern. On the daily chart, the price has been tightly range-bound for over three weeks, oscillating between a floor around 0.05 and a clearly defined resistance ceiling at 0.06. This ceiling is reinforced by multiple technical indicators, including the upper Bollinger Band, the 20-day Donchian channel, and the 50-day EMA. While this structure provides the necessary compression for a potential breakout, it is critically undermined by a complete lack of supporting momentum and a hostile higher-timeframe context. The daily ADX, at a very low 12.43, signals an absence of any directional trend, and the RSI at 35.66 remains firmly in bearish territory. More importantly, the weekly chart reveals that this daily range is merely a pause within a strong, established downtrend, confirmed by a high W1 ADX of 36.74 and a price trading far below key weekly moving averages. Therefore, the current structure is interpreted not as a base for a bullish breakout, but as a bearish consolidation with a higher probability of resolving downwards. The framework would only become relevant if price were to decisively reclaim the 0.06 level with a concurrent surge in volume and momentum.

Continuation: Directional Flow Assessment
The Continuation framework is deemed not plausible for SEI/USDC at this time due to a clear absence of directional momentum. While the overarching weekly and daily structures remain bearish, with price positioned well below key moving averages like the D1 EMA50 (0.06), the immediate market dynamic has shifted from a trend to a state of pronounced consolidation. This is most evident in the D1 ADX reading of 12.43, a value that signals a non-trending, apathetic market. For the past month, price action has been tightly compressed within the 0.05-0.06 range, accompanied by declining volume. This prolonged period of low-volatility sideways movement directly contradicts the 'Stable Directional Flow' signature required for a continuation scenario. Furthermore, the price is currently holding at a significant support confluence around 0.05, which includes the weekly pivot and S1 level. For the Continuation framework to become relevant, the market would first need to establish a clear directional breakout from this range, supported by a resurgence in both volume and trend strength as measured by the ADX.
Comparative Framework Verdict
Comparing the three technical frameworks, the Range/Rebound scenario emerges as the most coherent and plausible interpretation of the current market structure for SEI/USDC. It accurately captures the dominant characteristic of the daily chart: a well-defined, low-volatility consolidation between the 0.05 support and 0.06 resistance. The plausibility of this framework is strongly supported by the extremely low daily ADX (12.43), which confirms the absence of a directional trend, and a significant confluence of technical support at the 0.05 level, making a rebound from this floor a logical possibility. In stark contrast, both the Breakout and Continuation frameworks are deemed not plausible. Their core weakness is identical: they both require directional momentum, a condition that is fundamentally absent in the current market. The prevailing apathy and price compression are the antithesis of the energetic flow needed to sustain either a breakout or a trend continuation. The current structure is better understood as a pause within a larger downtrend, rather than a launchpad. Consequently, the immediate focus remains on the integrity of the 0.05-0.06 range. The resolution of this price compression, either through a successful defense of the 0.05 support leading to a rotation upwards or a failure that results in a breakdown, will be the key technical development to monitor.
For broader market context, readers can also review the latest related fundamental analysis for this pair.
For live market monitoring and the full interactive chart, readers can access the dedicated SEI Market Hub.
Disclaimer
CopyTradia provides technical analysis for informational and educational purposes only. This content does not constitute financial advice, investment recommendations, or trading signals. Cryptocurrency markets are highly volatile. Past performance is not indicative of future results. Always conduct your own research (DYOR) and consult a qualified financial advisor before making any investment decisions.


