SEI/USDC Bearish Continuation: Downtrend Dominates
- CopyTradia Intelligence

- Jun 11
- 5 min read
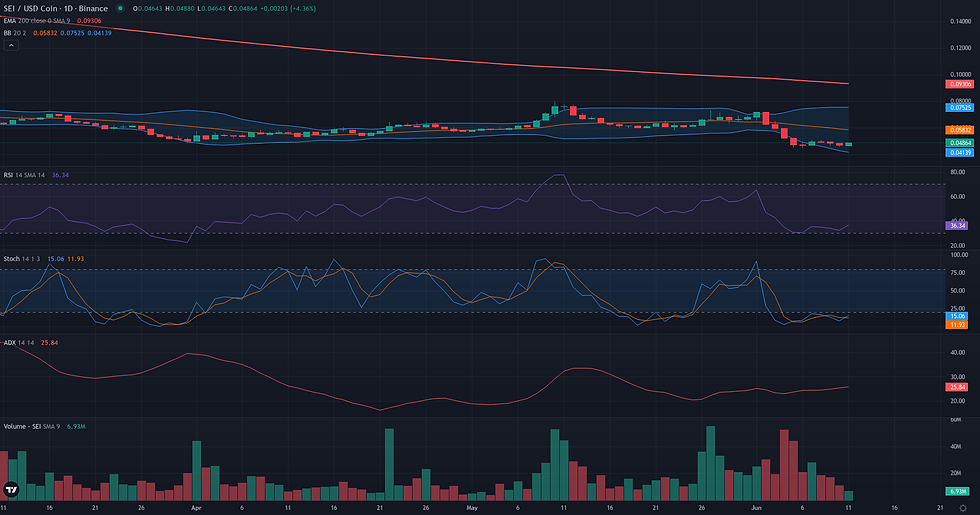
This SEI/USDC bearish continuation examines the current SEI/USDC structure in the context of support defense and weakening alternative frameworks. SEI/USDC is currently navigating a powerful bearish trend, with the price consolidating near multi-week lows around the 0.05 level. The technical structure is unambiguously weak, with the asset trading significantly below key moving averages such as the daily EMA50 at 0.06 and the weekly EMA50 at 0.14. Trend strength indicators confirm this directional bias, with the weekly ADX at a high reading of 38.46, signaling a mature and dominant downtrend. While the daily RSI at 32.18 is approaching oversold territory, suggesting a potential slowdown in selling pressure, momentum remains firmly negative. This technical pressure aligns with recent fundamental observations of a market gripped by extreme fear, suggesting the current price action is part of a broader deleveraging event within the asset's ecosystem. The current consolidation represents a critical juncture, with technical frameworks pointing to either a pause before further decline or a potential stabilization at key support.

Range & Rebound Resolution: Support and Friction Zones
The resolution of the Range/Rebound framework for SEI/USDC is contingent on the defense of its validation zone between 0.04 and 0.05 USDC. This area represents a critical support floor, but the asset is currently caught in a state of extreme compression, as evidenced by the 4H price action, reflecting profound market indecision. The immediate path for the framework is defined by clear technical obstacles and potential invalidation triggers. The primary invalidation condition is a daily close below the 0.04 USDC support cluster. A breach of this level would negate the stabilization thesis and signal a likely continuation of the powerful weekly downtrend noted in the initial analysis. Before any meaningful recovery, the framework must overcome several friction zones. The first major hurdle is at 0.06 USDC, a confluence of the daily 50-period exponential moving average (EMA 50 D1) and the weekly pivot point. A rejection from this level would keep the short-term structure under bearish pressure. A second friction zone lies at 0.07 USDC, the weekly R1 pivot. Confirmation of a successful rebound would require a decisive daily close above the 0.06 USDC resistance, supported by a notable increase in trading volume. This would shift the structure in favor of buyers and open the path towards projection zones, initially targeting 0.07 USDC and potentially extending to 0.08 USDC (W1 R2). Conversely, the framework will weaken if price continues to stagnate at 0.05 USDC with persistently low volume, suggesting a lack of buying interest and increasing the probability of a support breakdown.

Breakout: Structural Catalyst Assessment
The Breakout framework is assessed as not plausible for SEI/USDC at this time. The market structure fundamentally contradicts the required conditions for a potential upward break. Instead of consolidating under a well-defined resistance, the price has recently experienced a structural breakdown, falling from a support zone around 0.06-0.07 to establish new lows near 0.04. This price action signals a continuation of the prevailing downtrend, not a preparation for a reversal. This bearish view is reinforced across multiple indicators. Momentum is weak, with the Daily RSI at 32.18 and the Weekly RSI at 34.00, both reflecting sustained selling pressure. The ADX on both timeframes (D1 25.39, W1 38.46) confirms that the market is in a directional, bearish trend. Furthermore, the weekly context is prohibitive for a long breakout scenario; the price is trading significantly below major resistance levels such as the Weekly EMA50 at 0.14. For the Breakout framework to become relevant, the market would first need to halt its decline, establish a clear consolidation base, and then successfully reclaim the 0.06-0.07 zone, turning former support into a new floor for a potential future attempt.

SEI/USDC Bearish Continuation: Directional Flow Assessment
The technical structure for SEI/USDC presents a plausible bearish continuation scenario. The asset is situated within a dominant, multi-month downtrend, a context clearly defined by its position far below the weekly EMA50 (0.14) and EMA200 (0.35). This long-term directional flow is supported by a strong weekly ADX reading of 38.46, indicating a powerful and established trend. On the daily timeframe, this structure is mirrored, with price trading below the D1 EMA50 (0.06) and a daily ADX of 25.39 confirming the trend's presence. The current price action is characterized by a tight, multi-day consolidation around the 0.05 level, which followed a sharp decline in early June. This period of low volatility, confirmed by H1 data and a negative D1 Volume Oscillator (-18.79), is structurally consistent with a pause or 'flag' formation before a potential resumption of the primary trend. While the D1 RSI is low at 32.18, suggesting the market is nearing oversold conditions, the absence of any bullish divergence allows the bearish thesis to remain intact. The overall picture is one of a stable directional flow temporarily pausing, which aligns with the core signature of the Continuation framework.

Comparative Framework Verdict
In assessing the three strategic frameworks for SEI/USDC, a clear hierarchy emerges from the current technical structure. The bearish Continuation framework stands out as the most plausible scenario. Its coherence is drawn from the strong alignment between the daily and weekly timeframes, both of which exhibit a clear, high-momentum downtrend confirmed by ADX readings and price action relative to major moving averages. The current tight consolidation around 0.05 is interpreted as a temporary pause, characteristic of a market preparing for its next directional move in line with the established trend. Offering a counter-perspective, the Range/Rebound framework is deemed borderline. Its viability is anchored to the significant support confluence around the 0.04 level, where oversold daily indicators suggest selling momentum could be exhausted. However, this potential for a bounce directly conflicts with the powerful weekly bearish trend, making it a secondary and more tenuous thesis. Finally, the Breakout framework is assessed as not plausible. The market has recently broken down from support, which is the antithesis of the pre-breakout consolidation structure this framework requires. Looking ahead, the market's direction will likely be decided by the resolution of the conflict between daily oversold conditions and the dominant weekly trend. A sustained defense of the 0.04 support could give credence to the rebound scenario, while a definitive break below it would validate the continuation framework.
For broader market context, readers can also review the latest related fundamental analysis for this pair.
For live market monitoring and the full interactive chart, readers can access the dedicated SEI Market Hub.
Disclaimer
CopyTradia provides technical analysis for informational and educational purposes only. This content does not constitute financial advice, investment recommendations, or trading signals. Cryptocurrency markets are highly volatile. Past performance is not indicative of future results. Always conduct your own research (DYOR) and consult a qualified financial advisor before making any investment decisions.


