SEI Technical Analysis: Key Support at 0.06 Fails as Range Breaks Down
- CopyTradia Intelligence

- Jun 4
- 4 min read
This SEI technical analysis examines the current SEI/USDC structure in the context of support defense and weakening alternative frameworks. SEI/USDC is at a critical technical juncture, with price action challenging the lower boundary of a multi-week consolidation range. For weeks, the pair has been contained between approximately 0.06 and 0.07, a state of balance confirmed by a low D1 ADX of 23.42, indicating a non-trending environment. However, this local stability exists within a powerful, long-term weekly downtrend, evidenced by a strong W1 ADX of 39.11 and price trading significantly below key weekly moving averages. The current price action is testing the crucial 0.06 support level, with momentum indicators like the D1 RSI at a weak 42.72, suggesting a lack of buying pressure. This technical breakdown aligns with the underlying market tension highlighted in the latest fundamental analysis, which noted a prevailing short bias despite recent price performance. The resolution of this range is pivotal, as it will likely determine whether the market resumes its broader bearish trajectory or establishes a more durable price floor.

SEI Technical Analysis: Technical Framework Assessment
The Range/Rebound framework for SEI/USDC, initially identified as borderline, is now showing clear signs of invalidation based on the resolution data. The analysis started from the [0.060, 0.062] validation zone, a critical support floor defined by D1 lows and the D1 EMA 50. However, the 4H chart, our primary resolution timeframe, reveals a decisive price breakdown below this zone, with recent closes near 0.05 USDC. This bearish move is technically significant, confirmed by a spike in volume and a deeply oversold RSI at 25.21, indicating strong momentum behind the drop. The structural invalidation condition for this framework is a daily close below 0.060 USDC. If confirmed, this would dissolve the multi-week range structure and signal a likely continuation of the powerful weekly downtrend. Consequently, the former support zone at [0.060, 0.062] has now flipped into the primary friction zone, acting as immediate resistance against any potential recovery. Should buyers manage to push the price up, the next significant obstacle lies at 0.07 USDC, the top of the previous range. Confirmation of any rebound potential now requires a forceful reclaim of the 0.060 level on a daily closing basis. Conversely, continued trading below this level serves as a persistent weakening signal, confirming the breakdown's validity. Given the current price action, upward projection zones, such as 0.07 USDC or 0.08 USDC, are highly speculative and contingent on a market structure reversal that is not currently in evidence.


Breakout: Structural Catalyst Assessment
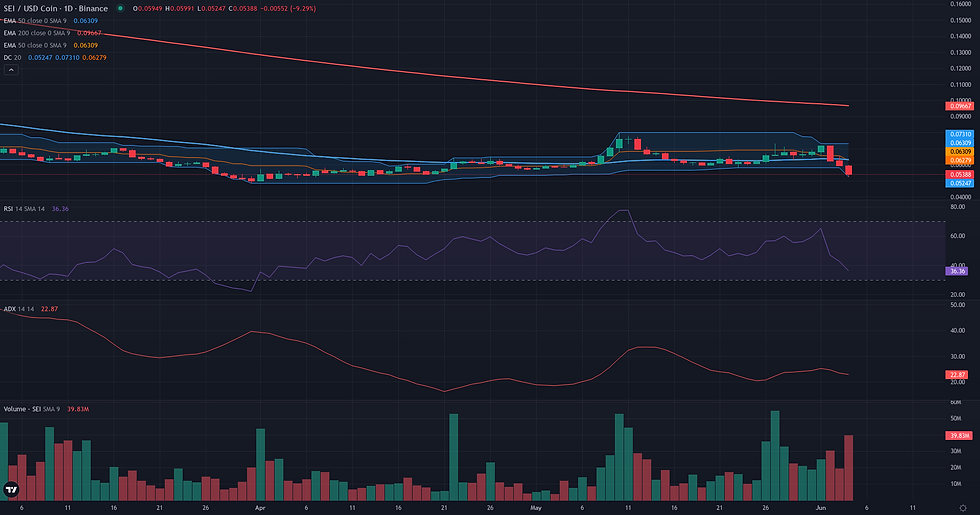
The Breakout framework is currently not plausible for SEI/USDC. The market structure presents a significant conflict between a local consolidation and a dominant bearish trend. On the daily chart, price has been trapped in a tight horizontal range between approximately 0.06 and 0.07 for several weeks. This compression, highlighted by narrow Bollinger Bands, typically precedes a significant directional move and forms the basis of a potential breakout scenario. However, this structural preparation is undermined by a lack of supporting momentum and a hostile weekly context. The daily RSI at 42.72 and weekly RSI at 39.04 both signal an absence of buying pressure. Furthermore, the weekly chart reveals a strong, established downtrend, with an ADX of 39.11 and price trading far below its key moving averages. For the Breakout framework to become relevant, the price would need to not only reclaim the 0.07 resistance but do so with a significant increase in volume and a clear shift in momentum, challenging the prevailing bearish sentiment.
Continuation: Directional Flow Assessment
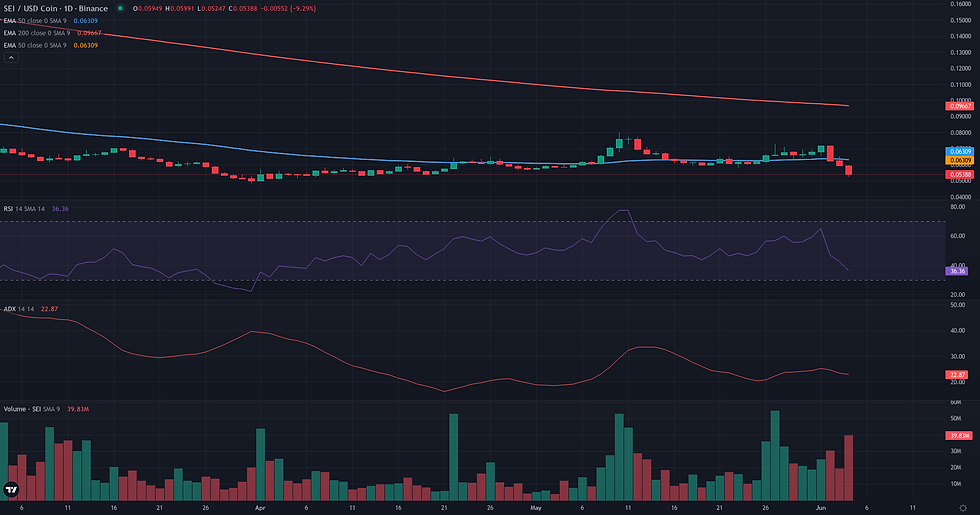
The Continuation framework is deemed not plausible for SEI/USDC at this time due to a clear absence of a directional trend on the daily chart. The market has been locked in a consolidation phase for several months, oscillating primarily between 0.05 and 0.08, after a significant prior downtrend. This range-bound behavior is the antithesis of the 'Stable Directional Flow' signature required by this framework. Key indicators confirm this lack of direction: the D1 ADX, at a low value of 23.42, signals a weak or non-existent trend, while the price hovers around its 50-day EMA (0.06), further illustrating market indecision. While the long-term context remains bearish with price well below its 200-day EMA (0.10), the immediate structure is one of balance, not continuation. For this framework to become relevant, the market would first need to establish a new, clear directional impulse by decisively breaking out of the current multi-month range.
Comparative Framework Verdict
The comparative analysis of the three strategic frameworks reveals a market in a state of transition, with no single framework currently dominant. The most relevant scenario, Range/Rebound, was initially assessed as 'borderline' due to the clear conflict between the D1 consolidation and the overriding W1 downtrend. Subsequent price action has shown this framework to be actively failing, as resolution analysis on the 4H timeframe indicates a decisive breakdown below the critical [0.060, 0.062] support zone. This development invalidates the immediate potential for a bullish rebound from the range floor. Both the Breakout and Continuation frameworks were deemed 'not plausible' from the outset. The upside Breakout was dismissed due to weak momentum and the fact that price was testing support, not resistance. The Continuation framework was similarly inapplicable because the market was characterized by sideways, non-trending price action on the daily chart, which is the antithesis of a stable directional flow. The failure of the range support is therefore the most significant technical event, resolving the structural ambiguity in favor of the bears and aligning the D1 timeframe with the dominant weekly downtrend. The key factor to monitor now is whether the breakdown below 0.06 is sustained on a daily closing basis, which would confirm the end of the consolidation phase.
For broader market context, readers can also review the latest related fundamental analysis for this pair.
For live market monitoring and the full interactive chart, readers can access the dedicated SEI Market Hub.
Disclaimer
CopyTradia provides technical analysis for informational and educational purposes only. This content does not constitute financial advice, investment recommendations, or trading signals. Cryptocurrency markets are highly volatile. Past performance is not indicative of future results. Always conduct your own research (DYOR) and consult a qualified financial advisor before making any investment decisions.


