SEI Range Rebound Analysis: Price Compresses at 0.05 Support

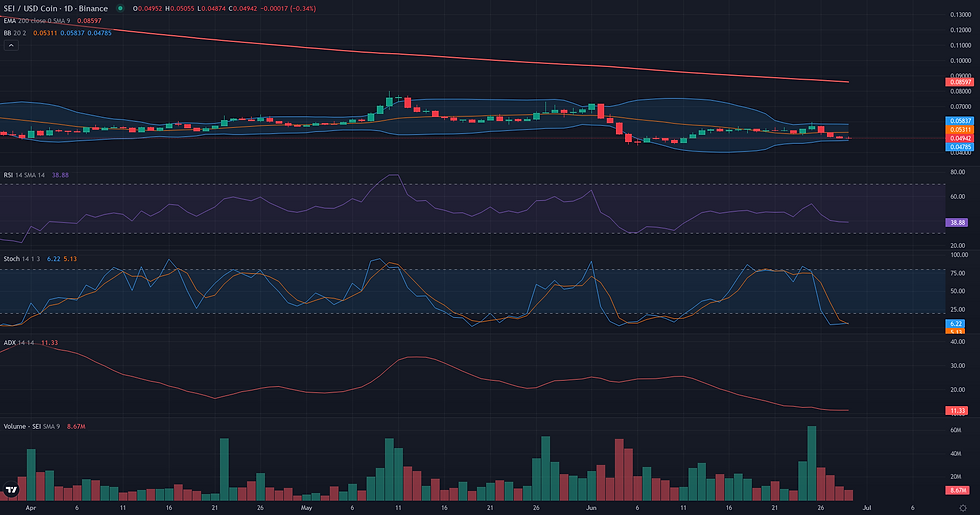
This SEI range rebound analysis examines the current SEI/USDC structure in the context of support defense and weakening alternative frameworks. SEI/USDC is currently locked in a phase of tight consolidation, with price action largely confined to a narrow channel between 0.05 and 0.06. This sideways movement reflects a market in equilibrium, a state quantitatively confirmed by a critically low Daily ADX reading of 11.32, which indicates a complete lack of directional trend. Momentum remains weak, with the Daily RSI at 39.16, struggling below the neutral 50-mark and suggesting an absence of significant buying pressure. This daily range-bound structure must be interpreted within the context of a dominant weekly downtrend, where the price remains significantly below key long-term moving averages. This technical picture of daily consolidation against a weekly downtrend aligns with recent fundamental analysis, which highlights a tension between ongoing speculative interest and the prevailing bearish price action. The current price compression sets the stage for the three technical frameworks that follow, each exploring a potential resolution to this period of market indecision.

SEI Range Rebound Analysis: Support and Friction Zones
The resolution for the SEI/USDC range rebound framework is defined by the critical 0.05 to 0.06 daily range. The validation for this borderline setup, as established in the entry phase, requires a daily close above the 0.06 resistance. This level represents a significant confluence, aligning with the range high, the D1 EMA 50, and the W1 R1 pivot, making it a formidable ceiling for buyers to overcome. The invalidation of this rebound thesis would occur with a sustained daily close below the 0.05 support. A breakdown of this level, which is also the weekly pivot point, would negate the range structure and likely signal a continuation of the prevailing weekly downtrend, opening the way towards the next structural support around 0.04 (W1 S2). Should the framework validate with a move above 0.06, the path is not without obstacles. An initial friction zone is anticipated around 0.07, an area of prior price consolidation. A more significant challenge lies near the D1 EMA 200 at 0.09, which also serves as the first major projection zone for a successful rebound. Beyond that, the W1 EMA 50 at 0.13 stands as a macro-level reference. Confirmation of the rebound's strength would involve not just breaking 0.06 but holding above it, turning former resistance into support. Conversely, the framework would weaken if price attempts to break 0.06 but is aggressively rejected, or if it continues to languish at the 0.05 lows with low volume, as currently suggested by the 4H indicators.

Breakout: Structural Catalyst Assessment
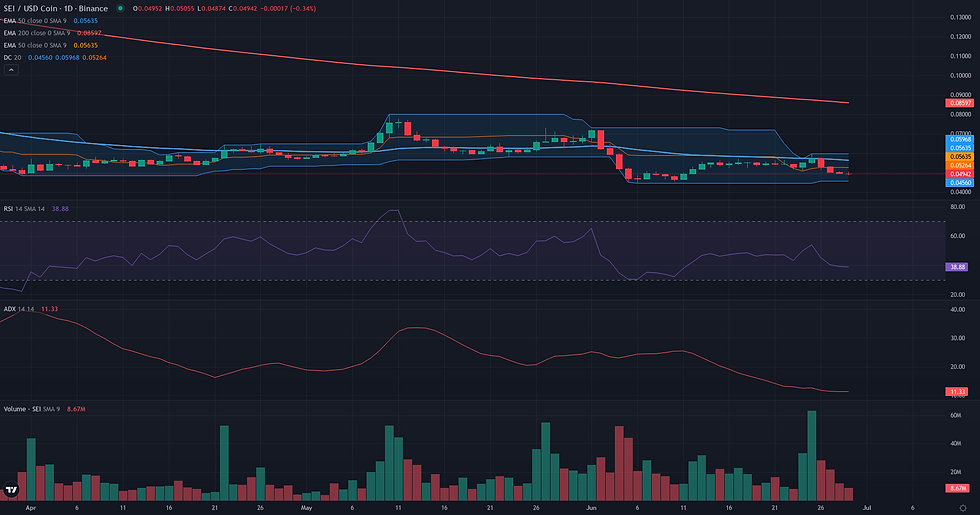
The current market structure for SEI/USDC presents a deceptive technical picture that does not support a plausible Breakout framework at this time. On the surface, the daily chart displays a classic pre-breakout characteristic: a prolonged phase of price compression within a tight horizontal range, capped by a clearly defined resistance at 0.06 USDC. This level represents a significant confluence of technical barriers, including the upper Bollinger and Donchian bands, the daily EMA 50, and the weekly R1 pivot. However, this structural pattern lacks the essential underlying dynamics required for a structural break. The most critical flaw is the complete absence of directional energy, as indicated by a D1 ADX value of just 11.32, signaling an untrending and listless market. Compounding this weakness, the broader weekly context remains firmly bearish. Price is trading significantly below its key weekly moving averages, and the weekly ADX of 36.74 confirms that the dominant, long-term trend is a strong and active downtrend. Therefore, the current daily consolidation is more likely a pause within this larger bearish trend than a base for a bullish reversal. For the Breakout framework to become relevant, the market would need to demonstrate a fundamental shift, starting with a sustained build-up in momentum and a decisive, high-volume breach of the 0.06 resistance.
Continuation: Directional Flow Assessment
The Continuation framework is not considered plausible at this time due to the market's pronounced lack of directional momentum on the daily timeframe. The price structure is defined by a protracted consolidation phase, with price action tightly contained between the 0.05 and 0.06 levels for several weeks. This range-bound behavior is quantitatively confirmed by a critically low ADX D1 reading of 11.32, which signals an absence of any discernible trend. While the weekly chart maintains a long-term bearish posture, with price trading well below key moving averages like the W1 EMA50 at 0.13, this macro context is insufficient to justify a continuation scenario when the primary D1 timeframe exhibits clear horizontal structure and inertia. The 'Stable Directional Flow' signature is therefore not met. For this framework to become relevant, the market would first need to resolve this consolidation with a decisive breakout, accompanied by a significant rise in directional momentum indicators.

Comparative Framework Verdict
In the current market structure for SEI/USDC, the Range/Rebound framework emerges as the most relevant, albeit with a 'borderline' plausibility. This scenario accurately captures the prevailing price action: a clear daily consolidation between the 0.05 support and 0.06 resistance, which is strongly supported by a lack of directional trend (D1 ADX at 11.32). In contrast, both the Breakout and Continuation frameworks are deemed 'not plausible'. They fail on the same fundamental condition: the absence of the directional energy required to either sustain a trend or fuel a structural break. The market is demonstrably ranging, not trending, on the daily timeframe. The primary challenge for the Range/Rebound thesis is its counter-trend nature. The daily consolidation is occurring within a powerful, established weekly downtrend, making any potential upward move a fight against a strong prevailing force. A decisive daily close above the 0.06 resistance would be the first signal that buyers are absorbing selling pressure. Conversely, a breakdown below the 0.05 support would invalidate the range structure and likely signal a resumption of the broader bearish trend. The key element to monitor is how price resolves this tight 0.05-0.06 channel, as this will dictate the next significant directional move.
For broader market context, readers can also review the latest related fundamental analysis for this pair.
For live market monitoring and the full interactive chart, readers can access the dedicated SEI Market Hub.
Disclaimer
CopyTradia provides technical analysis for informational and educational purposes only. This content does not constitute financial advice, investment recommendations, or trading signals. Cryptocurrency markets are highly volatile. Past performance is not indicative of future results. Always conduct your own research (DYOR) and consult a qualified financial advisor before making any investment decisions.


