NEAR/USDC Range Rebound Analysis: Stabilization Above Support
- CopyTradia Intelligence

- Jun 18
- 5 min read
This NEAR/USDC range rebound analysis examines the current NEAR/USDC structure in the context of support defense and weakening alternative frameworks. NEAR/USDC is currently in a phase of technical consolidation after a sharp rejection from its early June high of 3.08. With the price closing at 2.18, the market is navigating a period of indecision, holding above a critical support cluster formed by the D1 EMA50 at 1.98 and the W1 EMA50 at 2.06. Momentum indicators reflect this equilibrium, with the daily RSI sitting at a neutral 51.29. However, the D1 ADX remains elevated at 31.89, suggesting that while the immediate trend has paused, underlying volatility persists. This current phase of technical consolidation follows a period of strong fundamental momentum, which saw NEAR gain nearly 70% over the last month and expand its derivatives exposure. The present structure suggests the market is now testing whether that prior bullishness can be absorbed and defended at these new support levels, setting the stage for the next directional move.

NEAR/USDC Range Rebound Analysis: Support and Friction Zones
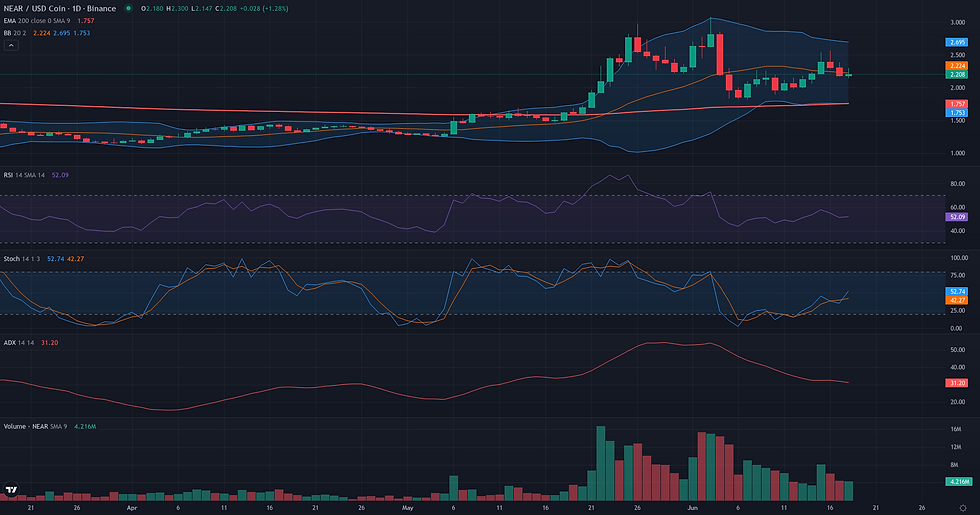
The resolution of the Range/Rebound framework for NEAR/USDC is contingent on the market's behavior around the established validation zone of 1.75 - 1.89 USDC. This zone represents the current floor of stabilization. The framework would lose its technical coherence if the price were to break this floor. Specifically, a daily close below the 1.75 USDC level, which is reinforced by the D1 EMA 200, would constitute a clear invalidation, signaling a probable continuation of the prior downtrend. For the rebound to gain traction, it must first navigate several layers of resistance. The initial friction zone lies between 2.25 USDC (D1 Pivot) and 2.36 USDC (W1 R1). Overcoming this area would be a first sign of strength. A more significant test awaits at the 2.50 - 2.56 USDC resistance, which caps the recent highs and aligns with the W1 R2 pivot. A decisive D1 close above 2.56 would serve as a strong confirmation of the rebound, suggesting that buyers have absorbed the overhead supply and are ready to push higher. If confirmed, the primary technical projection for such a move would be the prior structural high at 3.08 USDC. Conversely, the framework would show signs of weakening if the price fails to hold above the D1 EMA 50 at 1.98 USDC and falls back to retest the 1.81-1.89 lows, indicating that buying pressure is insufficient to sustain a recovery.

Breakout: Structural Catalyst Assessment
The Breakout framework is currently not technically plausible for NEAR/USDC. The primary reason for this assessment is the absence of a preparatory consolidation phase beneath the key structural resistance. The market has clearly defined its recent ceiling at the 3.08 USDC level, a price point marked by the Donchian 20 D1 upper band and the early June high. However, instead of coiling tightly below this level to build energy for a potential break, the price experienced a sharp rejection and has since entered a consolidation phase in the middle of its recent range. This price action is not characteristic of the structural pressure that typically precedes a breakout. This reading is further supported by a lack of conviction in market dynamics. The D1 Volume Oscillator is notably negative at -21.43%, indicating that recent trading volumes are significantly lower than average, which contradicts the accumulation of interest expected for a major move. Concurrently, momentum is neutral, with the D1 RSI at 51.29, reflecting market indecision rather than building directional strength. While the price remains above the weekly EMA50 (2.06 USDC), providing some structural support, the broader weekly context (ADX at 17.89) points to a non-trending environment. For this framework to become relevant, a fundamental shift in structure would be required, involving a sustained re-test and consolidation directly under the 3.08 USDC resistance, backed by a clear resurgence in both volume and momentum.

Continuation: Directional Flow Assessment
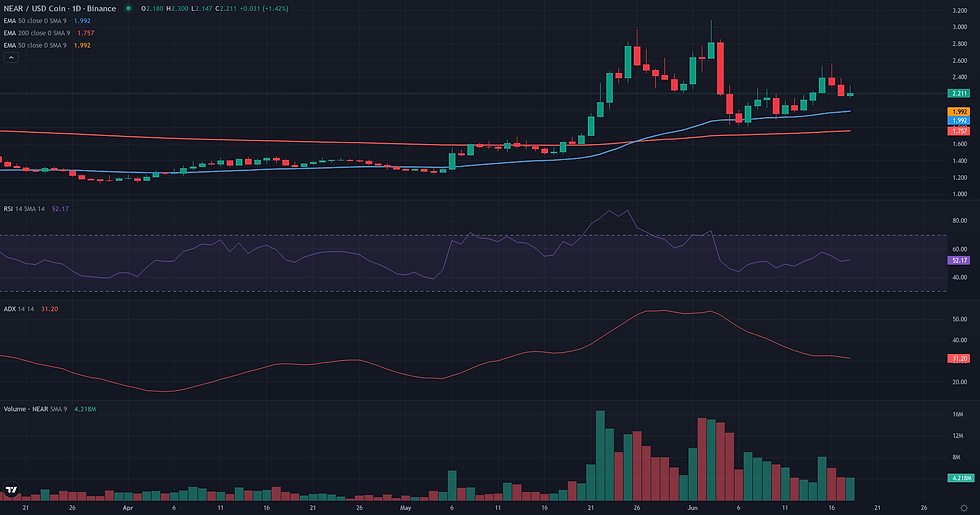
The technical structure for NEAR/USDC presents a borderline case for a bullish continuation. The primary supporting factor is the market's recovery from the sharp correction that bottomed at 1.81. Since then, price has established a series of higher lows, building a constructive base above a critical support confluence formed by the D1 EMA50 (1.98), the W1 S1 Pivot (1.98), and the W1 EMA50 (2.06). This structural defense suggests buyers are absorbing selling pressure in a key zone. Furthermore, the D1 ADX at 31.89 confirms the daily timeframe is in a trending environment. However, this potential continuation is tempered by several factors that prevent a more confident reading. The recovery has occurred on weakening volume, as shown by a D1 Volume Oscillator of -21.43, and daily momentum is neutral with an RSI of 51.29. More importantly, the weekly trend strength is low (W1 ADX 17.89), indicating that the daily recovery has not yet translated into a powerful, higher-timeframe directional flow. This creates a tension between a promising D1 basing pattern and a lack of decisive, broad-based momentum, making the continuation framework technically plausible but still tentative.
Comparative Framework Verdict
In assessing the current market structure for NEAR/USDC, a clear hierarchy of technical plausibility emerges from the three analytical frameworks. The most coherent scenario is the Range/Rebound framework, which is rated as plausible. This view is supported by the clear price stabilization that has occurred following the sharp decline from 3.08. The market has established a potential floor between 1.75 and 1.89, a zone reinforced by the D1 EMA 200. Neutral momentum and a weekly inside bar pattern further strengthen the case for a period of range-bound activity rather than an immediate directional trend. The second most likely scenario, a bullish Continuation, is considered borderline. While it correctly identifies a constructive price structure with a series of higher lows above key moving averages, it is weakened by a lack of conviction. Neutral daily RSI, low weekly trend strength, and declining volume all suggest that the upward recovery lacks the momentum needed for a confident continuation at this time. Finally, the Breakout framework is rated not plausible. The market is consolidating far from the key 3.08 resistance, and lacks the volume and momentum buildup typically required to fuel a structural break. The key determinant for the near future will be whether the support defined by the Range/Rebound framework holds, or if bullish momentum can build sufficiently to validate the Continuation thesis.
For broader market context, readers can also review the latest related fundamental analysis for this pair.
For live market monitoring and the full interactive chart, readers can access the dedicated NEAR Market Hub.
Disclaimer
CopyTradia provides technical analysis for informational and educational purposes only. This content does not constitute financial advice, investment recommendations, or trading signals. Cryptocurrency markets are highly volatile. Past performance is not indicative of future results. Always conduct your own research (DYOR) and consult a qualified financial advisor before making any investment decisions.


