Dogecoin Consolidation Analysis: Bearish Continuation vs. Rebound
- CopyTradia Intelligence

- Jun 18
- 4 min read
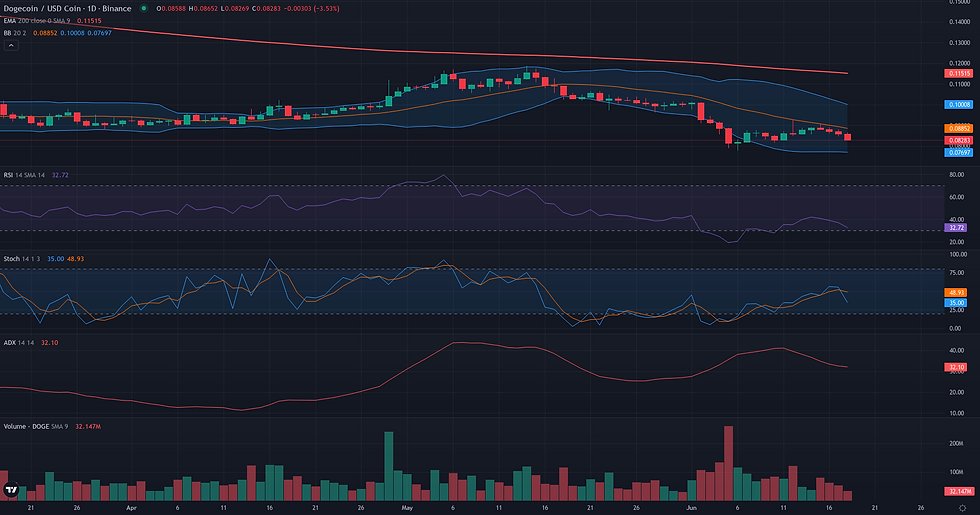
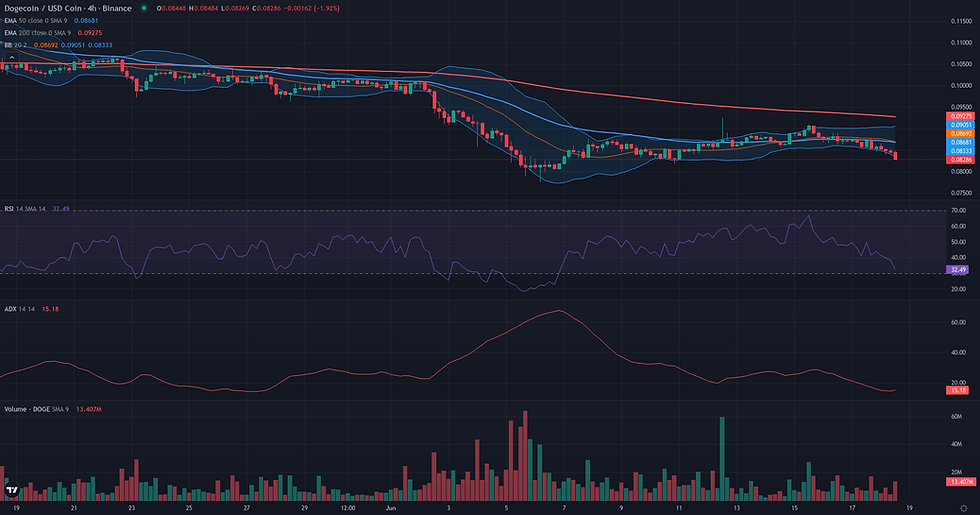
This Dogecoin consolidation analysis examines the current DOGE/USDC structure in the context of support defense and weakening alternative frameworks. DOGE/USDC is currently confined to a tight consolidation range between 0.08 and 0.09, representing a period of indecision following a significant bearish trend. The market structure remains under pressure, with the price trading well below key long-term averages such as the D1 200-period EMA at 0.12. Trend strength indicators confirm this underlying bias, with the D1 ADX at a high reading of 32.55, suggesting the prior downtrend remains potent. Momentum is weak, as reflected by the D1 RSI of 37.11, which indicates a lack of buying pressure to challenge the established trend. This technical indecision is contrasted by on-chain derivatives data, which indicates renewed leveraged participation and a positive bias in positioning, suggesting some market participants are anticipating a resolution to the upside. The current price action therefore presents a critical juncture, balancing on a key support level while the dominant trend signals further weakness.

Range & Rebound Resolution: Support and Friction Zones
The resolution of the Range/Rebound framework for DOGE/USDC hinges on the price action around the 0.08-0.09 range. The scenario's validation requires a daily close above the 0.09 resistance, a level that has capped price for nearly two weeks. A successful break would suggest buyers are taking control after a period of stabilization. The framework would lose its coherence if the key support at 0.08 fails. A daily close below this level would constitute an invalidation, breaking the range structure and likely signaling a continuation of the prior downtrend. This risk is notable, given the elevated trend strength indicators mentioned in the entry analysis. Should the rebound be validated by a break above 0.09, the path forward is not without obstacles. The first major friction zone is located at 0.10. This area represents a technical confluence, including the D1 50-period EMA and the weekly R2 pivot, and marks a previous price consolidation zone. A decisive move above 0.10 would be a strong confirmation of the rebound's strength. If the framework develops successfully and clears the 0.10 friction zone, the primary technical projection lies at the 0.12 level. This area is a significant long-term structural resistance, anchored by the 200-period EMA on both the daily and weekly charts. A weakening of the rebound scenario would be signaled by repeated failures to close above 0.09 or a lack of upward momentum from the 0.08 support.
Breakout: Structural Catalyst Assessment
The Breakout framework is assessed as not plausible for DOGE/USDC at this time. While the daily chart exhibits a potential setup in the form of price compression within a tight range (0.08-0.09) directly beneath a well-defined resistance ceiling at 0.10, this structure lacks the required dynamic support. The confluence of the Donchian 20 upper, the upper Bollinger Band, and the EMA 50 at 0.10 creates a clear level, but the market shows no signs of preparing to break it to the upside. Critically, momentum is deeply bearish, with the D1 RSI at 37.11 and the W1 RSI at 37.39, indicating an absence of buying pressure. This weakness is reinforced by the broader weekly context, where the price remains firmly in a downtrend below major moving averages like the W1 EMA 200 (0.12). For this framework to become plausible, a significant shift in momentum would be required, evidenced by the D1 RSI reclaiming the 50 level, alongside a sustained price push through the 0.10 resistance.

Dogecoin Consolidation Analysis: Directional Flow Assessment
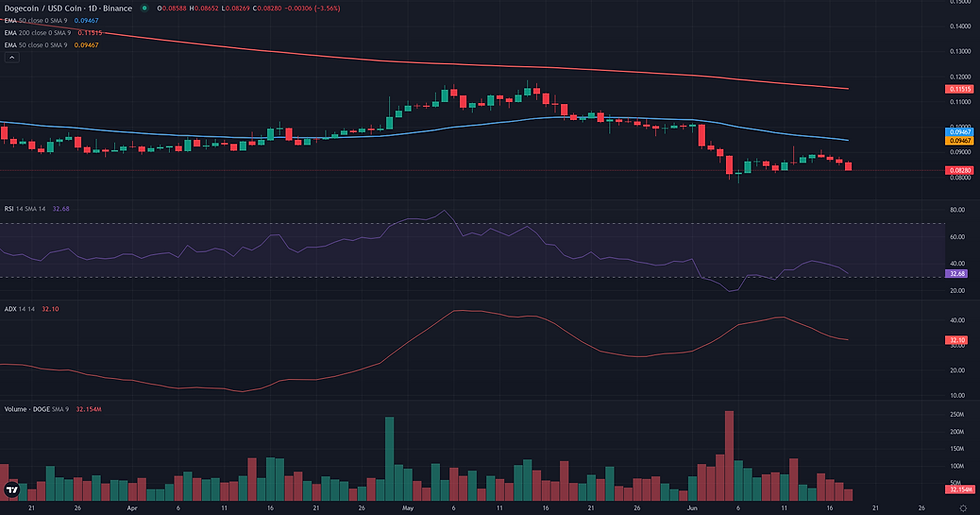
The technical structure for DOGE/USDC presents a plausible scenario for a bearish continuation. The dominant directional flow is clearly downward, confirmed by the price's position well below key long-term moving averages on both the daily (EMA 50 at 0.10, EMA 200 at 0.12) and weekly charts. This establishes a strong, overarching bearish context. Momentum indicators corroborate this view, with the ADX on the daily timeframe at 32.55, signaling a mature trend that has the potential to persist. The primary nuance in the current structure is the recent period of consolidation where price has stabilized above the 0.08 support, which corresponds to the weekly S1 pivot. This sideways movement, occurring on below-average volume (Volume Oscillator at -19.32), is currently interpreted as a pause or a temporary equilibrium within the broader downtrend rather than a structural reversal. The framework's plausibility hinges on the eventual resolution of this consolidation to the downside, in line with the prevailing trend.
Comparative Framework Verdict
The analysis of DOGE/USDC reveals a market at a technical crossroads, with two plausible but opposing frameworks emerging from the current price consolidation. The Bearish Continuation and Range/Rebound scenarios are both considered plausible, while the bullish Breakout framework is assessed as not plausible due to insufficient momentum. The Bearish Continuation framework is identified as the dominant scenario. Its plausibility is rooted in the strong, multi-timeframe downtrend, evidenced by the price's position below all key daily and weekly moving averages. The high ADX reading above 30 further supports the thesis that the current sideways movement is merely a pause before the trend resumes. This framework anticipates a resolution with a daily close below the 0.08 support level. As a close secondary, the Range/Rebound framework offers a compelling counter-argument. It focuses on the clear stabilization that has occurred above the 0.08 support confluence over the past two weeks, coupled with short-term indicators suggesting seller exhaustion. This scenario proposes a potential bounce from the current range, with validation contingent on a decisive close above the 0.09 resistance. The resolution of the 0.08-0.09 range is therefore the critical factor to monitor. A break below 0.08 would align with the dominant Continuation framework, while a push above 0.09 would lend credence to the secondary Rebound scenario.
For broader market context, readers can also review the latest related fundamental analysis for this pair.
For live market monitoring and the full interactive chart, readers can access the dedicated DOGE Market Hub.
Disclaimer
CopyTradia provides technical analysis for informational and educational purposes only. This content does not constitute financial advice, investment recommendations, or trading signals. Cryptocurrency markets are highly volatile. Past performance is not indicative of future results. Always conduct your own research (DYOR) and consult a qualified financial advisor before making any investment decisions.


