DOGE/USDC Range Rebound Analysis: Support at $0.07 Tested

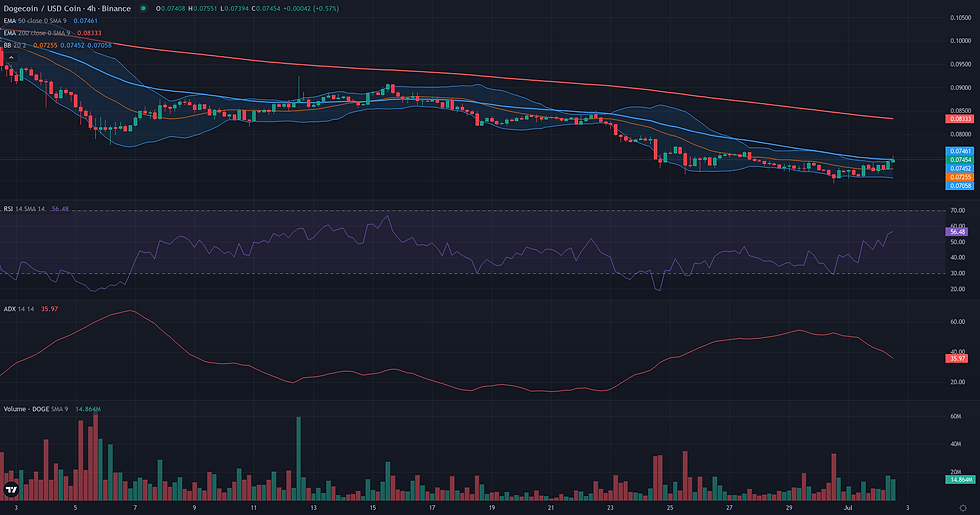
This DOGE/USDC range rebound analysis examines the current DOGE/USDC structure in the context of support defense and weakening alternative frameworks. DOGE/USDC is at a critical technical juncture, with price action compressing around the $0.07 support level for nearly a week. This stabilization occurs within a powerfully bearish market structure, creating a significant conflict for technicians. On one hand, the Daily RSI is deeply oversold at 23.01, a condition that often precedes a technical bounce or at least a pause in selling pressure. On the other hand, the Daily ADX remains high at 39.56, signaling that the underlying downtrend retains exceptional strength and is not yet exhausted. Price remains significantly below all key long-term moving averages, reinforcing the dominant bearish context. This technical indecision aligns with the broader market sentiment of 'extreme fear' and a noted contraction in leveraged positioning, suggesting the current pause may be driven by seller exhaustion rather than a decisive shift in control. The market is now coiled, awaiting a catalyst to resolve this tension.

DOGE/USDC Range Rebound Analysis: Support and Friction Zones
The resolution path for the DOGE/USDC Range/Rebound framework is precarious, starting from a validation condition requiring a reclaim and hold above 0.08 USDC. This level represents the first test for buyers attempting to establish a new range after a period of intense selling pressure. The current price action is characterized by tight compression around the 0.07 support floor, which aligns with the W1 S1 pivot, but this stabilization occurs under the shadow of a powerful bearish trend, as indicated by a high D1 ADX. The framework's coherence would be definitively broken with a daily close below this 0.07 support. This would constitute the invalidation condition, signaling that sellers have absorbed the nascent buying interest and are resuming the prior downtrend. Should the validation at 0.08 be achieved, the path upward is layered with significant friction. The 0.08 level itself is a resistance confluence, containing the W1 Pivot and R1. Overcoming this, buyers would then confront a more formidable barrier at 0.09, where the D1 EMA 50 and W1 R2 pivot converge. This zone is a critical test of the rebound's strength. A rejection here would severely weaken the framework. If the rebound can sustain momentum through these friction zones, the primary long-term projection reference is the D1 EMA 200 at 0.11. Confirmation of a structural shift would require not just reclaiming 0.08, but a decisive daily close above the 0.09 resistance cluster.

Breakout: Structural Catalyst Assessment
The Breakout framework is assessed as not plausible for DOGE/USDC at this time. The current market structure is antithetical to the conditions required for a bullish breakout, which typically involves a phase of consolidation or compression beneath a well-defined resistance level. Instead, the daily chart reveals a persistent downtrend throughout the past month, with price recently breaking down to new lows around the 0.07 level. This price action is occurring at the lower boundary of both the Donchian Channel and the Bollinger Bands, indicating bearish expansion rather than bullish preparation. Momentum indicators corroborate this view, with a deeply oversold D1 RSI of 23.01 and a high ADX of 39.56, both signaling a strong, ongoing downtrend. The weekly context further reinforces this bearish outlook, as the price is trading significantly below key long-term moving averages like the W1 EMA 50 (0.13). For the Breakout framework to become relevant, a fundamental structural change would be necessary, starting with the establishment of a bottom, a period of sideways consolidation, and a subsequent challenge of key overhead resistance levels such as the D1 EMA 50 at 0.09.

Continuation: Directional Flow Assessment
The technical landscape for a bearish continuation is currently in a state of tension, rendering the framework borderline. On one hand, the dominant structure is unequivocally bearish. Price action on both daily and weekly charts is unfolding well below key long-term moving averages, such as the Daily EMA 50 at 0.09 and the Weekly EMA 50 at 0.13. This deep structural weakness is further confirmed by a strong Daily ADX reading of 39.56, which signals a powerful, established trend. However, this macro-level bearish flow has encountered a significant obstacle. For the past five sessions, the price has stalled, entering a tight consolidation phase directly on top of a critical support confluence at 0.07, which corresponds to both the weekly low and the W1 S1 pivot. This halt in momentum is accompanied by a Daily RSI of 23.01, indicating an oversold condition that could fuel a counter-trend bounce. The lack of volume during this pause further suggests seller indecision. Until the market resolves this consolidation with a clear breakdown below 0.07, the immediate prospect for a stable continuation remains uncertain.

Comparative Framework Verdict
In synthesizing the three technical frameworks, a clear hierarchy emerges defined by the current market indecision. The Breakout framework is assessed as not plausible. Its core requirement—a period of consolidation under resistance—is absent; DOGE/USDC is instead testing new lows within a strong downtrend, making a bullish breakout scenario technically incoherent at this stage. The primary conflict lies between the two borderline frameworks: Range/Rebound and bearish Continuation. Both correctly identify the tension between the strong underlying downtrend and the current stabilization at the $0.07 support level. The Range/Rebound framework is considered marginally dominant as it most accurately describes the present price action: a multi-day pause at a support floor with oversold conditions. It frames the potential for a relief bounce, with a reclaim of $0.08 acting as its initial validation point. The Continuation framework is a close secondary, contingent on an event that has not yet occurred: a definitive breakdown below $0.07. While aligned with the macro trend, its immediate plausibility is tempered by the ongoing consolidation. The resolution of this tight range around $0.07 will ultimately determine which of these two competing scenarios prevails.
For broader market context, readers can also review the latest related fundamental analysis for this pair.
For live market monitoring and the full interactive chart, readers can access the dedicated DOGE Market Hub.
Disclaimer
CopyTradia provides technical analysis for informational and educational purposes only. This content does not constitute financial advice, investment recommendations, or trading signals. Cryptocurrency markets are highly volatile. Past performance is not indicative of future results. Always conduct your own research (DYOR) and consult a qualified financial advisor before making any investment decisions.


