DOGE $0.07 Support Analysis: Downtrend vs. Oversold Signals

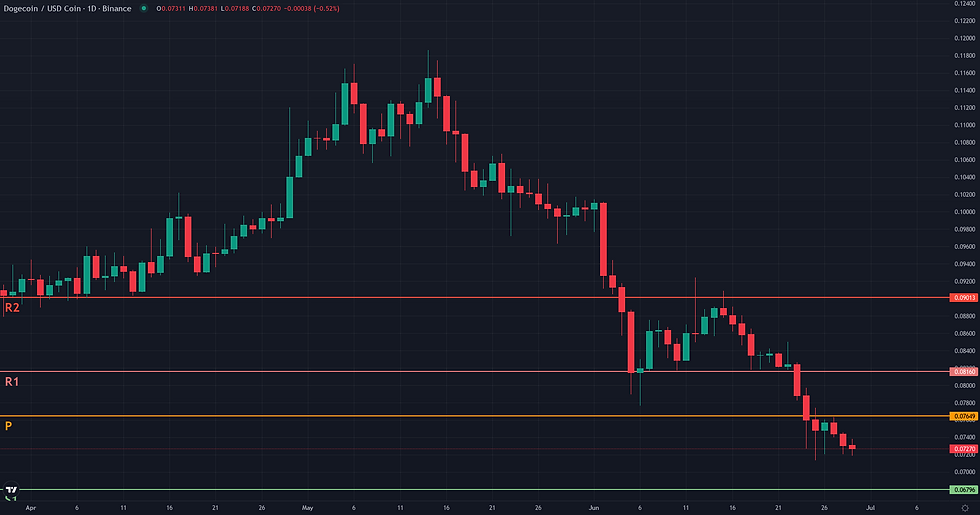
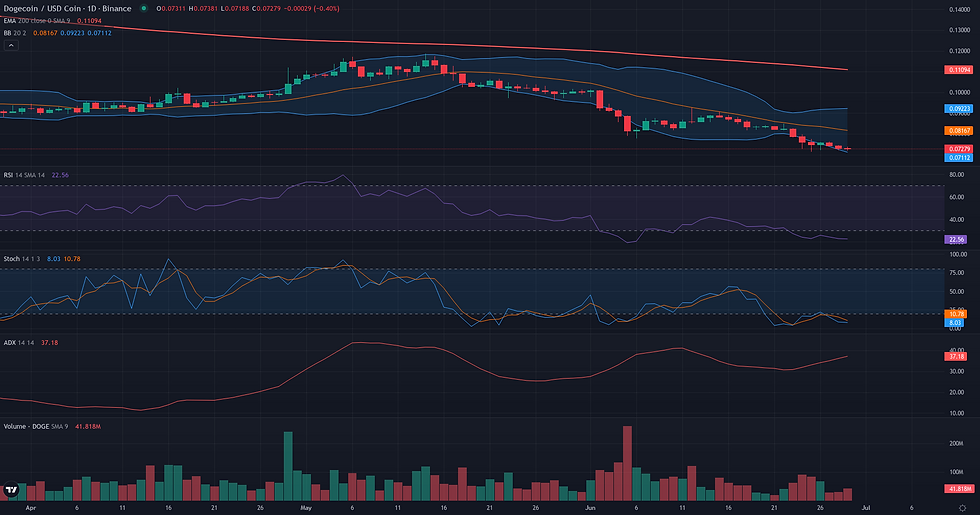
This DOGE $0.07 support analysis examines the current DOGE/USDC structure in the context of support defense and weakening alternative frameworks. DOGE/USDC is currently testing a critical support level around the $0.07 mark, following a sustained period of bearish pressure. The daily chart reveals a market in a state of high tension, caught between a powerful downtrend and signs of potential seller exhaustion. The Average Directional Index (ADX) on the daily timeframe remains elevated at 36.11, confirming the robustness of the prevailing downward trend. However, the Relative Strength Index (RSI) has fallen into deeply oversold territory with a reading of 22.88, a condition that often precedes a consolidation or a relief bounce. Price action is compressed, sitting well below key long-term moving averages like the D1 EMA 200 at $0.11. This technical pause at a critical support level occurs within a fundamental context of extreme fear and a contraction in leveraged positioning, suggesting the market is testing for exhaustion after a prolonged period of downward pressure. The current structure sets the stage for a potential resolution in either direction, hinging on whether the support at $0.07 can absorb the persistent selling interest.
DOGE $0.07 Support Analysis: Technical Framework Assessment
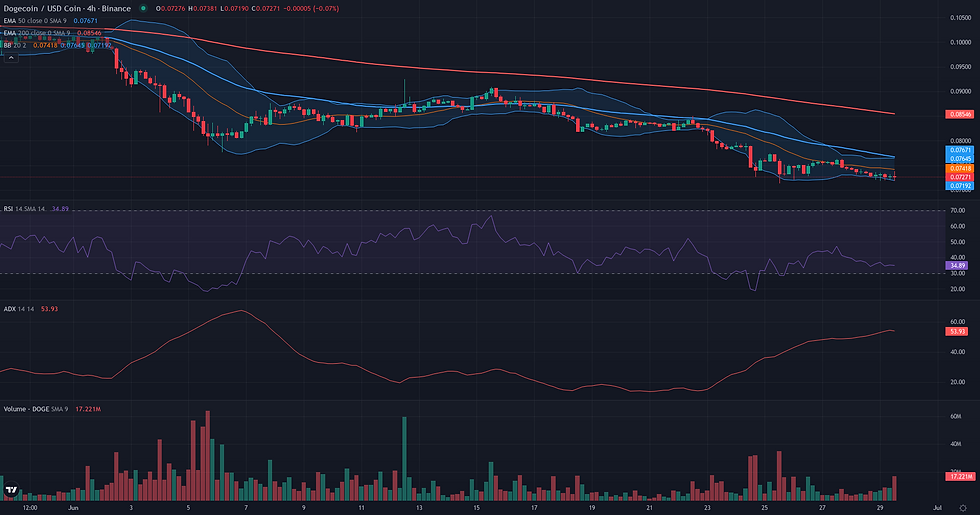
Following the borderline plausibility established for a Range/Rebound on DOGE/USDC, the resolution framework is defined by a tense balance between potential stabilization and a dominant bearish trend. The validation condition remains a daily close above the 0.08 level, which corresponds to the D1 Bollinger Middle Band and the weekly pivot point. This would be the first signal that buyers are attempting to neutralize the immediate downward pressure. However, the framework's coherence is fragile and would be invalidated by a daily close below the critical 0.07 support floor. This level is reinforced by daily S1/S2 pivots and recent structural lows; a breach would signal a failure of stabilization and a likely continuation of the downtrend. The resolution data from the 4H timeframe presents a significant challenge, with an extremely high ADX of 54.46 indicating the bearish trend is exceptionally strong and active. This suggests any upward move will face intense pressure. If the framework validates by closing above 0.08, the first major friction zone lies at 0.09. This area is a confluence of the D1 EMA 50 and the weekly R2 pivot, representing a significant technical and psychological barrier. A successful break of this friction zone would be a strong confirmation, opening a path toward the primary projection zone around 0.11, anchored by the D1 EMA 200. Conversely, a weakening of the framework would be evident if the price validates above 0.08 only to be immediately rejected, a scenario favored by the high trend strength.
Breakout: Structural Catalyst Assessment
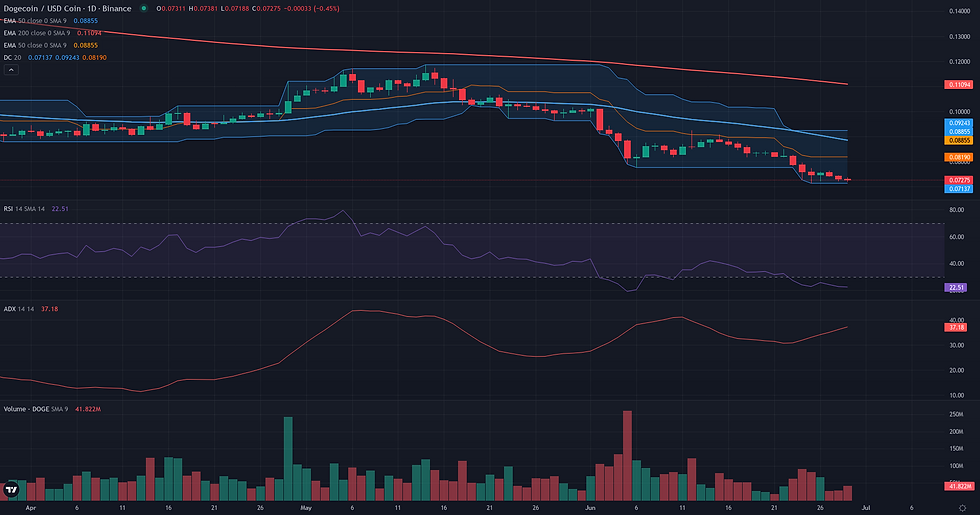
The Breakout framework is assessed as not plausible for DOGE/USDC at this time. The market structure is characterized by a clear and sustained bearish trend across both daily and weekly timeframes, which directly contradicts the foundational requirements for a bullish breakout scenario. Price is currently trading well below key structural moving averages, including the D1 EMA50 at 0.09 and the D1 EMA200 at 0.11, signaling a lack of underlying strength. Instead of consolidating under a resistance level, the price is actively exploring new lows, as evidenced by its position at the lower boundary of both the D1 Bollinger Bands (0.07) and the 20-day Donchian Channel (0.07). Momentum indicators reinforce this bearish outlook; the D1 RSI is in oversold territory at 22.88, and the D1 ADX at 36.11 confirms the presence of a strong trend, which is currently directed downwards. For this framework to become relevant, a significant structural change would be necessary, beginning with the market establishing a solid support base and reclaiming key levels such as the 0.09 area to neutralize the immediate downward pressure.
Continuation: Directional Flow Assessment
The technical structure for a bearish continuation presents a borderline case, characterized by a clear conflict between the established downtrend and signs of short-term exhaustion. On one hand, the directional flow is unambiguously negative. The price is trading significantly below key daily and weekly moving averages, such as the D1 EMA50 at 0.09 and the W1 EMA200 at 0.12, confirming a structurally bearish environment. Trend strength indicators like the D1 ADX at 36.11 further support the existence of a dominant, stable downward movement. However, this bearish thesis is challenged by several counter-signals suggesting the trend may be overextended. The daily RSI has fallen into oversold territory at 22.88, a condition that often precedes a consolidation or a relief bounce. This is corroborated by the price action itself, which has stalled precisely at the weekly S1 pivot support of 0.07. The micro-hourly chart confirms this pause with a tight, low-volatility consolidation over the last 48 hours. Furthermore, a negative D1 Volume Oscillator (-21.85) points to declining participation, weakening the case for an immediate and powerful continuation. The framework's plausibility therefore hinges on whether this pause is a temporary consolidation before the next leg down or the beginning of a more significant counter-trend move from a key support level.

Comparative Framework Verdict
Synthesizing the three technical frameworks reveals a market at a clear inflection point, with no single scenario dominating the current structure. The analysis presents two opposing yet equally plausible outcomes, while a third is definitively ruled out. The bullish Breakout framework is assessed as 'not plausible' due to the complete absence of pre-breakout conditions; the market is in a distinct downtrend, not consolidating under resistance. The core of the current DOGE technical analysis lies in the conflict between the bearish Continuation and the counter-trend Range/Rebound frameworks, both of which are rated 'borderline'. The Continuation case is supported by the powerful D1 and W1 downtrends, evidenced by high ADX readings and price trading far below key moving averages. This framework would be validated by a decisive daily close below the $0.07 support. Conversely, the Range/Rebound framework draws its plausibility from deeply oversold momentum indicators at this same $0.07 support confluence, suggesting the downward move is overextended and vulnerable to a bounce. Given this direct clash of credible signals at a pivotal price level, neither framework can be considered dominant. The immediate future for DOGE/USDC will likely be defined by the resolution of the $0.07 zone, which will either confirm the trend's continuation or initiate a technical rebound.
For broader market context, readers can also review the latest related fundamental analysis for this pair.
For live market monitoring and the full interactive chart, readers can access the dedicated DOGE Market Hub.
Disclaimer
CopyTradia provides technical analysis for informational and educational purposes only. This content does not constitute financial advice, investment recommendations, or trading signals. Cryptocurrency markets are highly volatile. Past performance is not indicative of future results. Always conduct your own research (DYOR) and consult a qualified financial advisor before making any investment decisions.


