Chainlink Technical Analysis: Consolidation vs. Bearish Trend
- CopyTradia Intelligence

- Jun 18
- 5 min read
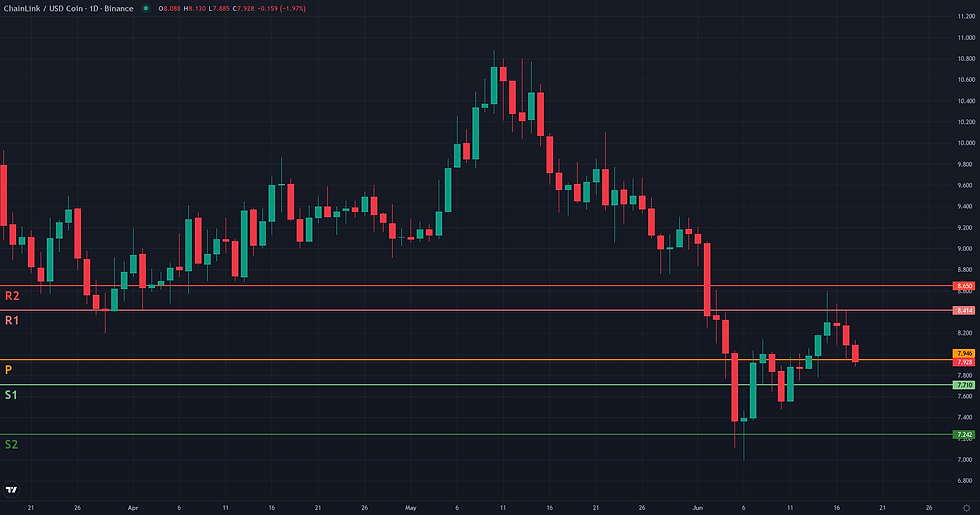
This Chainlink technical analysis examines the current LINK/USDC structure in the context of support defense and weakening alternative frameworks. LINK/USDC is currently navigating a period of technical indecision, consolidating around the 8.09 level after a significant price decline earlier in the month. The daily chart reflects a market in equilibrium, with the ADX at a low 23.35, indicating a lack of a strong immediate trend. Momentum remains subdued, with the D1 RSI at 42.92, struggling to reclaim the neutral 50-point threshold. This short-term stabilization, however, exists within a challenging broader context. The weekly timeframe maintains a clear bearish structure, with price trading significantly below key moving averages and the W1 ADX at 31.57 signaling a persistent underlying downtrend. This technical indecision aligns with recent fundamental analysis, which highlights a short-term price recovery taking place amidst significant underlying market tensions and leverage-related pressures. The current structure presents a conflict between daily consolidation and weekly bearish pressure, setting the stage for the competing technical frameworks discussed below.
Chainlink Technical Analysis: Technical Framework Assessment
Starting from the validation condition of a daily close above the 8.53-8.60 USDC resistance, the resolution of this Range/Rebound framework for LINK/USDC hinges on navigating a complex technical landscape defined by local stabilization versus a dominant weekly downtrend. The primary invalidation zone for this rebound scenario is a D1 close below the 7.48-7.71 support cluster. This area, which includes the D1 S2 pivot (7.67), represents the floor of the recent consolidation. A breach of this level would signify a failure of the stabilization attempt and a likely resumption of the broader bearish trend, invalidating the rebound thesis. Should the price move towards confirmation, it will encounter several friction zones. The first is the 8.41-8.65 area, a confluence of the W1 R1/R2 pivots and the recent swing high. Overcoming this is necessary but not sufficient. A more formidable obstacle lies just above at the D1 EMA 50 (8.76), a key dynamic resistance. A third friction point exists around the 9.00-9.15 level, a zone of prior structural relevance. If these resistances are cleared, the technical projection zones come into focus. The first logical reference is the 9.40-9.60 area, a prior consolidation range. A more extended move could target the significant swing highs from early May, located around 10.25-10.88. Confirmation of the framework’s strength would require not just breaking but holding above the D1 EMA 50 at 8.76, ideally with rising volume. Conversely, a clear weakening signal would be a rejection from the 8.53-8.60 resistance, especially if it results in price falling back below the weekly pivot at 7.95, indicating sellers remain in firm control.


Breakout: Structural Catalyst Assessment
The Breakout framework is currently not plausible for LINK/USDC. The market structure fundamentally lacks the necessary preconditions for a structural break to the upside. A valid breakout scenario typically emerges from a phase of price compression or consolidation directly beneath a well-defined resistance level, signaling an accumulation of energy. The current daily chart, however, depicts a market in a low-momentum rebound phase following a significant price decline from 10.10 to a low of 7.00. There is no observable horizontal range or tightening pattern that would suggest building pressure. This structural weakness is corroborated by key indicators. Momentum remains bearish, with the D1 RSI at 42.92 and the W1 RSI at 37.60, both well below the neutral 50 threshold. Furthermore, the D1 Volume Oscillator at -22.58% indicates that the recent bounce lacks conviction and volume support. The broader weekly context acts as a major headwind, with the price trading far below its key moving averages (W1 EMA 50 at 12.19) within an established downtrend. For the Breakout framework to become relevant, the price would first need to establish a sustained period of consolidation under a clear resistance, such as the 8.76-9.30 zone, accompanied by a notable improvement in both momentum and volume.

Continuation: Directional Flow Assessment
The technical structure for LINK/USDC presents a compelling but unresolved case for a bearish continuation. The primary directional bias is dictated by the weekly timeframe, which shows a decisive breakdown from a multi-month consolidation range in early June. This move has positioned the price significantly below key long-term averages like the W1 EMA 50 (12.19) and established a strong bearish momentum regime, confirmed by a W1 RSI of 37.60 and a trending W1 ADX of 31.57. However, the daily chart introduces a critical element of uncertainty that tempers this outlook. Following the sharp decline to the 7.00 low, the price has entered a corrective phase, characterized by choppy price action and a series of higher lows. This lack of immediate directional impulse is quantified by a low D1 ADX of 23.35, suggesting a pause in the trend. While the price remains contained below significant dynamic resistance, such as the D1 EMA 50 at 8.76, it has not yet shown a clear rejection or a definitive break of its recent support structure. This tension between the powerful weekly bearish context and the current daily indecision makes the continuation framework borderline, pending a structural resolution on the daily chart.

Comparative Framework Verdict
In assessing the three strategic frameworks for LINK/USDC, the analysis reveals a market at a crossroads with no single dominant scenario. Instead, two competing narratives, both rated as borderline, encapsulate the current technical tension. The Range/Rebound framework finds merit in the recent price stabilization on the daily chart, where support has formed following the drop to 7.00. However, its plausibility is capped by the overarching bearish trend on the weekly chart and a distinct lack of volume conviction. Conversely, the bearish Continuation framework is anchored in this strong weekly downtrend but is tempered by the lack of immediate follow-through on the daily chart, which is currently corrective rather than trending. The Breakout framework is unequivocally the weakest of the three, rated as not plausible. It fails due to a fundamental lack of the necessary preconditions, namely a clear price compression pattern below a major resistance and supporting momentum. The current structure is a low-energy bounce, not a build-up of directional pressure. Consequently, the market's direction will likely be determined by the resolution of the conflict between the two borderline scenarios: whether the daily support structure gives way to the weekly bearish pressure or manages to build a more convincing rebound.
For broader market context, readers can also review the latest related fundamental analysis for this pair.
For live market monitoring and the full interactive chart, readers can access the dedicated LINK Market Hub.
Disclaimer
CopyTradia provides technical analysis for informational and educational purposes only. This content does not constitute financial advice, investment recommendations, or trading signals. Cryptocurrency markets are highly volatile. Past performance is not indicative of future results. Always conduct your own research (DYOR) and consult a qualified financial advisor before making any investment decisions.


