Chainlink Range Rebound Analysis: Support at $7.00 Tested

This Chainlink range rebound analysis examines the current LINK/USDC structure in the context of support defense and weakening alternative frameworks. The LINK/USDC pair is currently navigating a period of technical consolidation, holding above a critical support level established around $7.00. With the price closing at $7.35, the market structure reflects a clear state of indecision. Momentum indicators on the daily timeframe are subdued, with an RSI of 38.12 suggesting persistent bearish pressure, though the ADX at 24.34 indicates that the preceding trend is losing strength, creating conditions conducive to range-bound activity. Price remains significantly below key moving averages, including the 50-day EMA at $8.22, reinforcing a broader bearish context on higher timeframes. This technical consolidation near multi-week lows aligns with the broader market context of deteriorating sentiment and significant price contraction, suggesting the current range represents a period of indecision rather than a confirmed directional catalyst. The immediate challenge for the asset is to demonstrate strength by moving away from the range lows and challenging overhead resistance.

Chainlink Range Rebound Analysis: Support and Friction Zones
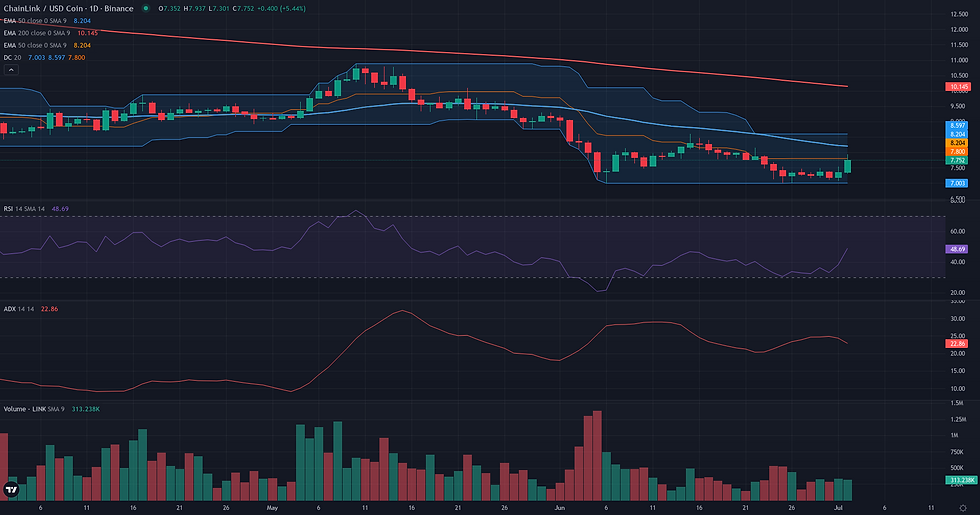
The resolution for the LINK/USDC Range/Rebound framework is centered on the 7.72 - 8.00 validation zone, which represents the immediate battleground between daily stabilization and weekly bearish pressure. For the rebound to gain credibility, the price must overcome this critical area. The invalidation point for this entire framework is a structural breakdown below the multi-tested daily support at 7.00. A D1 close below this level would negate the rebound thesis and suggest the dominant weekly downtrend is resuming. Between the current price and a potential trend reversal lie several friction zones. The first and most significant is the 7.72 - 8.00 validation zone itself, which is reinforced by the D1 R2 pivot (7.78) and the W1 R1 pivot (7.94). A successful push through this area would immediately face a second obstacle around the D1 EMA 50 at 8.22, a key moving average that previously acted as support. If the rebound can clear these hurdles, the primary technical projection zone is the 8.60 - 8.61 area, which marks a confluence of the mid-June swing high and the W1 R2 pivot. Confirmation of the rebound would be a decisive D1 close above 8.00, turning resistance into support. Conversely, a clear rejection from this zone would be a significant weakening signal, suggesting the sellers remain in control.

Breakout: Structural Catalyst Assessment
The Breakout framework is currently not plausible for LINK/USDC. The core condition for this strategy—a phase of price compression directly beneath a well-defined resistance—is absent from the current market structure. Instead of coiling for a potential upward break, the price has been rejected from the key daily resistance at 8.60 (Donchian 20 D1 upper) and has since fallen into the lower portion of its recent range, closer to the 7.00 support level. This price action does not align with the expected pre-breakout consolidation. The lack of buying pressure is further substantiated by momentum indicators, with the D1 RSI at a weak 38.12. Broadening the perspective, the weekly context presents a significant headwind. The asset is in a clear downtrend, trading far below its W1 EMA 50 (11.83), and the W1 RSI (34.06) confirms this underlying weakness. For the Breakout framework to become relevant, the structure would need to fundamentally change, requiring a sustained move back towards the 8.60 level and the formation of a clear consolidation pattern, supported by a significant improvement in momentum.
Continuation: Directional Flow Assessment
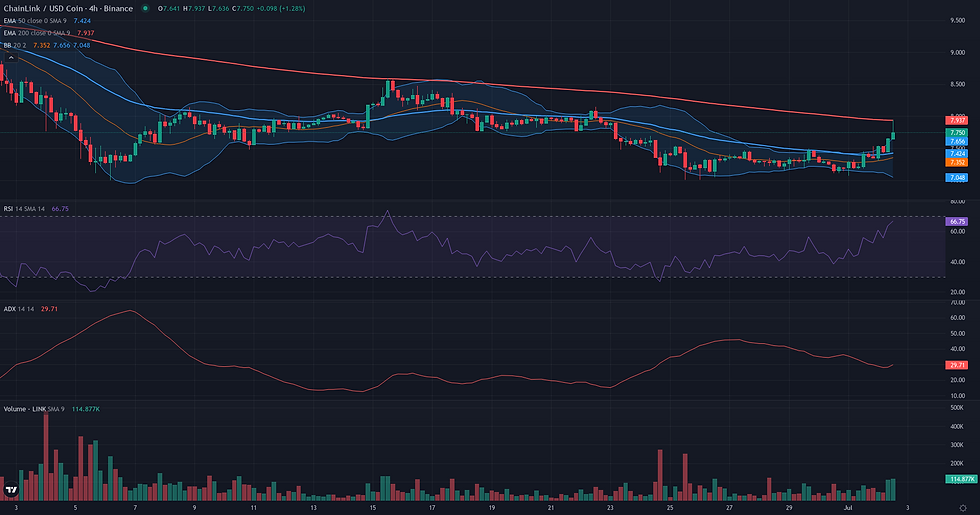
The technical structure for a Continuation framework is currently borderline, defined by a clear tension between the dominant bearish trend and the current corrective price action. On a weekly and daily basis, the market context is unambiguously bearish, with price trading well below key long-term moving averages like the D1 EMA 50 (8.22) and W1 EMA 50 (11.83). This broader structure supports the thesis of a potential bearish continuation. However, the 'Stable Directional Flow' required by the framework is absent in the immediate D1 structure. Following a sharp decline in early June, the price has entered a month-long consolidation phase. More importantly, a vigorous counter-trend rally has emerged from the 7.00 support level, as seen in the H1 data. This rally is now testing a significant resistance area near the 4H EMA 200 (7.97). The framework's plausibility hinges on the outcome of this test: a rejection would realign the market with the primary downtrend, whereas a sustained break above this resistance and the D1 EMA 50 would challenge the continuation scenario.

Comparative Framework Verdict
In assessing the three strategic frameworks for LINK/USDC, a complex picture emerges where no single scenario is dominant, but the Range/Rebound framework provides the most relevant lens for the current price action. This framework is rated as borderline plausible because it directly addresses the key structural feature on the daily chart: the defense of the multi-tested support zone around $7.00. Its validity, however, is challenged by the strong underlying bearish trend on the weekly timeframe. The Continuation framework is also considered borderline. It correctly captures the dominant bearish macro trend but is weakened by the present market conditions. The month-long consolidation and the sharp counter-trend rally from the lows disrupt the 'stable directional flow' that a clear continuation pattern requires. Essentially, both borderline frameworks capture the same core conflict from different perspectives: daily support versus weekly trend. The Breakout framework is deemed not plausible. The necessary precondition of price compressing tightly under a well-defined resistance is absent. Instead, the price is trading near the bottom of its range, showing signs of stabilization rather than preparation for an upward break. The key takeaway is the tension between the potential for a daily rebound and the risk of a bearish continuation. The market's next significant move will likely be determined by its ability to either reclaim resistance around the $7.72-$8.22 area or decisively break below the critical $7.00 support.
For broader market context, readers can also review the latest related fundamental analysis for this pair.
For live market monitoring and the full interactive chart, readers can access the dedicated LINK Market Hub.
Disclaimer
CopyTradia provides technical analysis for informational and educational purposes only. This content does not constitute financial advice, investment recommendations, or trading signals. Cryptocurrency markets are highly volatile. Past performance is not indicative of future results. Always conduct your own research (DYOR) and consult a qualified financial advisor before making any investment decisions.


