Chainlink Price Analysis: Support at $7.00 Tested
- CopyTradia Intelligence

- Jun 25
- 4 min read
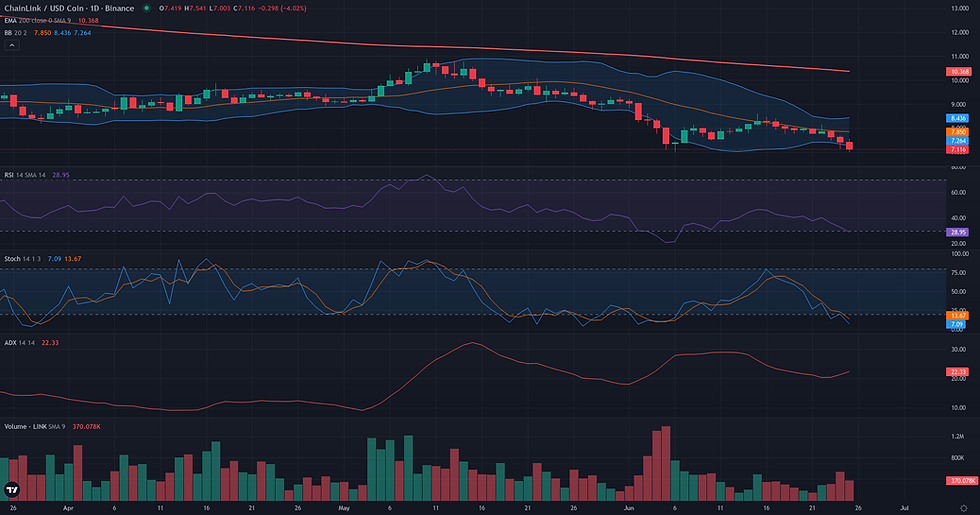
This Chainlink price analysis examines the current LINK/USDC structure in the context of support defense and weakening alternative frameworks. The LINK/USDC pair is currently at a critical technical juncture, consolidating near a major support zone around the $7.00 level after a significant decline. The market structure reflects a state of indecision, caught between short-term stabilization and a broader bearish context. On the daily chart, the ADX reading of 21.27 indicates a weak or non-existent trend, suggesting the market has entered a ranging phase. However, the D1 RSI remains low at 32.87, signaling that bearish pressure persists despite weakening momentum. Price action continues to unfold well below key moving averages, such as the daily 50-period EMA at $8.52, reinforcing the underlying structural weakness. This technical battle at support unfolds against a backdrop of broader market caution, where declining sentiment and a state of 'Extreme Fear' contrast with Chainlink's relative strength against other major assets. The following analysis explores three competing frameworks to interpret this complex structure.

Chainlink Price Analysis: Technical Framework Assessment
The resolution for this borderline Range/Rebound framework for LINK/USDC depends on whether the daily stabilization can overcome significant bearish pressure evident on shorter timeframes. The validation condition, established in the entry phase, is a daily close above the 7.86 USDC level, which would signal a potential shift in control to buyers. Conversely, the framework would be invalidated by a daily close below the critical 7.00 USDC structural low. Such a breakdown would negate the rebound thesis and suggest a continuation of the dominant weekly downtrend. The path to confirmation is challenging, as the price faces immediate and layered resistance. The first friction zone lies between 7.70 and 8.04 USDC, a confluence of the daily R1 pivot, the validation level itself, and the weekly pivot. Should buyers push through, a second major obstacle is located around 8.33-8.52 USDC, an area containing the weekly R1 pivot and the daily 50-period EMA. A confirmed rebound clearing these zones would project towards the weekly R2 pivot at 8.88 USDC as the next structural reference. The framework's coherence is currently being tested by a strong 4H downtrend (ADX at 35.41). A weakening of the rebound attempt would be signaled by a failure to hold above the daily pivot at 7.41 and a rejection from the 7.70-7.86 resistance.

Breakout: Structural Catalyst Assessment
The Breakout framework is currently not plausible for LINK/USDC. The primary condition for this framework—price compression below a well-defined resistance—is absent. Instead, the market structure displays a clear short-term downtrend. The price recently failed to hold above 8.00 and is now actively moving away from the key resistance ceiling located between the EMA 50 D1 at 8.52 and the Donchian 20-day high at 8.60. This price action signals rejection, not preparation for a structural break. The lack of bullish intent is further corroborated by momentum indicators. The D1 RSI, at a low value of 32.87, reflects prevailing weakness rather than building pressure. On a broader scale, the weekly chart provides a bearish context, with the price trading significantly below its major moving averages (W1 EMA 50 at 12.02), suggesting that any potential daily upside move would be counter to the dominant trend. For a Breakout reading to become relevant, the structure would first need to neutralize the current downtrend, likely by reclaiming levels above the 8.00-8.30 area, and then build a sustained consolidation phase directly challenging the 8.60 resistance.

Continuation: Directional Flow Assessment
The technical landscape for LINK/USDC presents a bearish continuation scenario that is currently at a critical juncture, rendering the framework borderline. The dominant directional flow is unequivocally downward, with price trading well below key structural moving averages on both daily (EMA50 at 8.52) and weekly (EMA50 at 12.02) charts. This establishes a strong bearish context. However, the immediate plausibility of continuation is challenged by the price's current position. The market is testing a significant horizontal support zone between 7.00 and 7.12, an area that has halted declines multiple times in early June. A stable continuation requires a clean break of this floor, which has not yet occurred. This structural obstacle is compounded by secondary signals suggesting a lack of conviction: the daily ADX at 21.27 indicates a weak trend, and the negative Volume Oscillator (-5.75) points to diminishing volume on the recent price decline. Until the 7.00 support is decisively breached with renewed momentum, the risk of a bounce or consolidation from this level tempers the outlook for an immediate and orderly continuation of the downtrend.

Comparative Framework Verdict
Comparing the three technical frameworks for LINK/USDC reveals a market at an inflection point, with no single scenario clearly dominating. The Breakout framework is rated 'not_plausible' as the current market structure lacks the necessary preconditions; price is in a downtrend and moving away from resistance, rather than compressing beneath it in preparation for an upward move. The primary conflict lies between the Range/Rebound and Continuation frameworks, both of which are assessed as 'borderline'. The Range/Rebound scenario finds its basis in the daily chart, where a low ADX suggests a loss of trend momentum and the price is testing a significant support cluster around the $7.00 mark. This framework outlines a potential stabilization and bounce. Conversely, the Continuation framework aligns with the dominant weekly bearish trend but is currently challenged by this very same support level and a lack of strong volume on the recent decline. Because these two frameworks represent the opposing outcomes of the current price action at a critical level, neither can be considered dominant. The resolution hinges on the market's reaction to the $7.00 support zone: a successful defense would favor the rebound, while a decisive break below would validate the continuation.
For broader market context, readers can also review the latest related fundamental analysis for this pair.
For live market monitoring and the full interactive chart, readers can access the dedicated LINK Market Hub.
Disclaimer
CopyTradia provides technical analysis for informational and educational purposes only. This content does not constitute financial advice, investment recommendations, or trading signals. Cryptocurrency markets are highly volatile. Past performance is not indicative of future results. Always conduct your own research (DYOR) and consult a qualified financial advisor before making any investment decisions.


