Chainlink 7.00 Support Analysis: Rebound or Continuation?

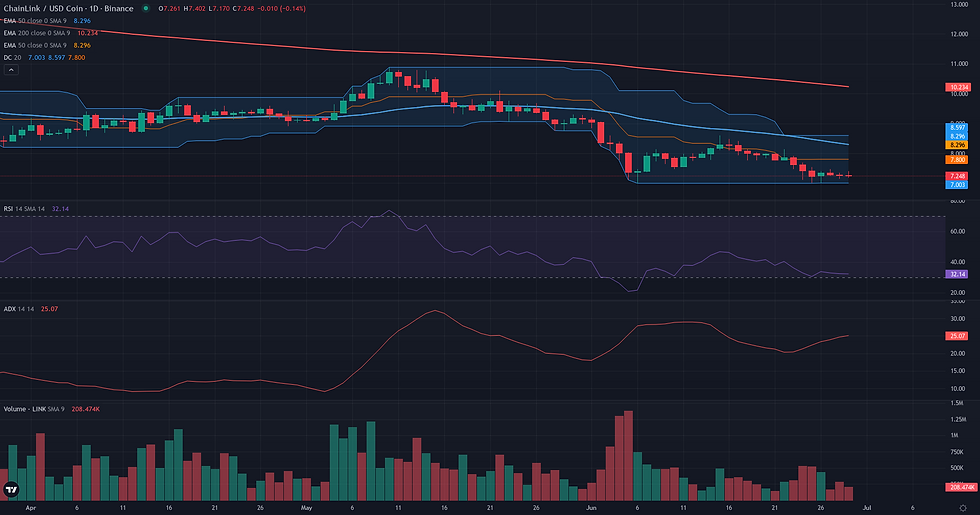
This Chainlink 7.00 support analysis examines the current LINK/USDC structure in the context of support defense and weakening alternative frameworks. LINK/USDC is currently in a state of technical indecision, consolidating just above the critical support level of 7.00 USDC after a sustained bearish trend. With the price closing around 7.26, the market is trading significantly below key moving averages like the 50-day EMA (8.34), confirming a broader bearish context. Momentum indicators reflect this pause; the daily RSI sits at 32.31, indicating persistent weakness but approaching oversold conditions, while the ADX at 24.63 suggests the recent directional trend has lost its immediate strength. This technical indecision reflects the broader market's deteriorating sentiment and significant price contraction noted in recent fundamental analysis, with derivatives data showing reduced leveraged exposure. The current price action has therefore reached a pivotal point, where the market must resolve whether the 7.00 support level will serve as a base for a rebound or as a temporary floor before the next leg down.

Chainlink 7.00 Support Analysis: Technical Framework Assessment
The resolution for the LINK/USDC range rebound framework is centered on the 7.00 USDC support level. Starting from the validation condition of a sustained move above the 7.80 - 8.00 zone, the framework's coherence depends on defending this key floor. The invalidation point is therefore a daily close below 7.00 USDC. Such a breakdown would nullify the double bottom pattern observed on the daily chart and signal a likely resumption of the strong weekly downtrend, potentially targeting lower supports like the W1 S1 pivot at 6.79. Before the framework can even test its validation zone, it faces several friction points. The immediate obstacle is a resistance cluster formed by the D1 R1 pivot at 7.35 and the Weekly pivot at 7.47. The price is currently struggling to overcome this area. Should buyers succeed, the next and most significant hurdle is the validation zone itself (7.80 - 8.00), which also contains the W1 R1 pivot at 7.94. A decisive move through this area is required to confirm the rebound scenario. If the rebound is confirmed, the first logical projection zone lies at the confluence of the D1 50-period EMA (8.34) and the W1 R2 pivot (8.61). This 8.34 - 8.61 area represents a significant structural resistance. Confirmation of the rebound would involve not just breaking above 8.00, but holding it as support, ideally with rising 4H momentum (RSI > 50). Conversely, the framework would weaken if the price is firmly rejected from the current 7.35-7.47 resistance, indicating that buying pressure is insufficient to challenge the prevailing bearish structure.


Breakout: Structural Catalyst Assessment
The Breakout framework is assessed as not plausible for LINK/USDC at this time. The market structure is characterized by a clear bearish trend on both daily and weekly timeframes, which fundamentally contradicts the premise of a bullish breakout. Price is currently consolidating near its recent lows around 7.26, significantly below key dynamic and static resistance levels, including the daily EMA 50 at 8.34 and the recent swing high of 8.60. Instead of the required compression phase beneath a resistance ceiling, the chart displays a post-breakdown pause. Momentum indicators corroborate this weakness, with the D1 RSI at a low 32.31 and the Volume Oscillator at -12.94, signaling a lack of buying pressure or accumulation. The weekly context reinforces this view, with price well under its major moving averages and a high ADX (31.58) confirming the strength of the prevailing downtrend. For this framework to become relevant, a significant structural change would be required, such as price reclaiming the 8.34-8.60 zone and building a new consolidation base above it.
Continuation: Directional Flow Assessment
The technical structure for LINK/USDC presents a borderline case for a bearish continuation. The primary directional context is unambiguously negative, with the price trading well below key long-term moving averages on both the daily (EMA 50 at 8.34) and weekly (EMA 50 at 11.83) charts. This alignment establishes a clear bearish regime. However, the immediate downward momentum has stalled. For several sessions, the price has entered a tight consolidation phase, holding above the critical support level of 7.00, which marks the low of the past month. This pause is reflected in the D1 ADX (24.63), which sits just below the threshold for a strong trend, suggesting the directional flow has weakened locally. While the weekly trend remains robust (W1 ADX at 31.58), the daily structure is at a point of indecision. The continuation framework is therefore not fully plausible yet, as it requires a clear resolution of this consolidation. A confirmed breakdown below the 7.00 support would be necessary to validate the resumption of the bearish trend.

Comparative Framework Verdict
In this week's LINK technical analysis, no single framework emerges as dominant. Instead, the market structure is defined by a critical standoff at the 7.00 USDC support level, leading to two competing but equally plausible scenarios. The Range/Rebound and Continuation frameworks are both assessed as borderline, effectively capturing the two potential outcomes of the current consolidation. The Range/Rebound case is built on the defense of the 7.00 support, which has held on multiple tests, suggesting potential for a counter-trend bounce. This scenario would gain credibility with a sustained move above the 7.80 - 8.00 resistance zone. Conversely, the bearish Continuation framework aligns with the strong weekly downtrend and would be validated by a daily close below the same 7.00 support, signaling a resumption of the primary trend. The Breakout framework is the weakest of the three and is considered not plausible. The current market structure lacks the necessary conditions for a bullish breakout, such as price compression below a key resistance. Instead, LINK is consolidating near recent lows, with weak momentum and declining volume, which is antithetical to a breakout setup. The market's next directional move is therefore heavily dependent on the resolution of the 7.00 support. A failure to hold this level would validate the continuation thesis, while a strong defense could shift focus toward the rebound scenario.
For broader market context, readers can also review the latest related fundamental analysis for this pair.
For live market monitoring and the full interactive chart, readers can access the dedicated LINK Market Hub.
Disclaimer
CopyTradia provides technical analysis for informational and educational purposes only. This content does not constitute financial advice, investment recommendations, or trading signals. Cryptocurrency markets are highly volatile. Past performance is not indicative of future results. Always conduct your own research (DYOR) and consult a qualified financial advisor before making any investment decisions.


