BNB Range Rebound Analysis: Momentum Fades, Range Forms
- CopyTradia Intelligence

- Jun 18
- 4 min read
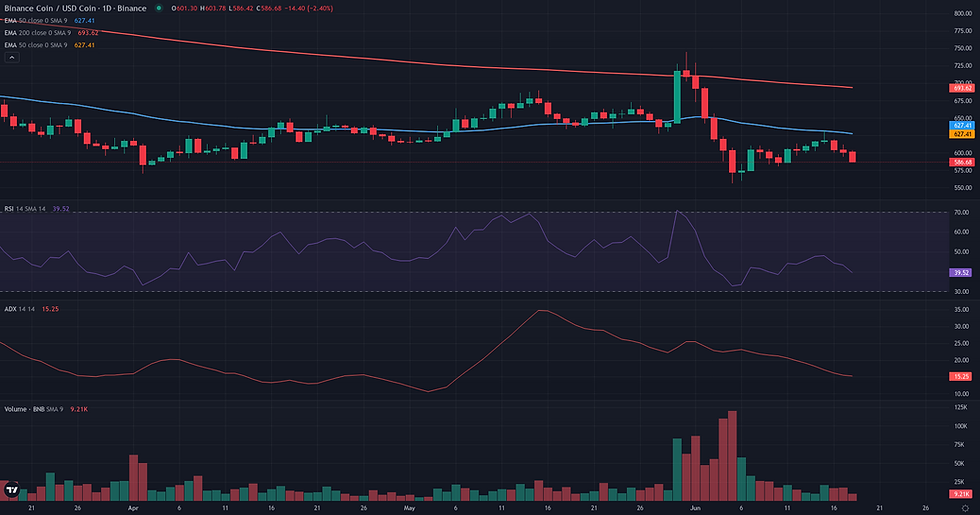
This BNB range rebound analysis examines the current BNB/USDC structure in the context of support defense and weakening alternative frameworks. BNB/USDC is currently navigating a period of consolidation around the 600 USDC level, following a sharp correction that erased its early June gains. The price is trading below its key daily moving averages, the 50-day EMA at 629.08 and the 200-day EMA at 705.27, confirming a bearish short-term structure. However, directional pressure has evaporated, as shown by an extremely low D1 ADX reading of 15.51, which signals a distinct lack of trend. Momentum, measured by the D1 RSI at 43.32, remains in bearish territory but is not oversold, reflecting the current sideways drift. This technical consolidation aligns with recent analysis highlighting contracting volatility and a shift towards a more contained price environment for BNB. The market now appears to be defining the boundaries of a new range after finding support near the critical weekly 200-period EMA.

BNB Range Rebound Analysis: Support and Friction Zones
The range rebound framework, which required a sustained break above the 617.00 - 622.57 zone for validation, is currently facing a critical test. Recent price action on the 4-hour chart shows an initial push through this validation area, reaching a high of 632.56. However, this attempt was met with a decisive rejection, sending the price back down towards 590.00. This failure highlights the first significant friction zone for any rebound: the 629.00 - 633.00 area. This level represents a technical confluence, including the daily EMA 50 (629.08) and the weekly R1 pivot (628.97), and now stands as a clear barrier that bulls must overcome. The entire rebound scenario is predicated on the market defending the major structural low at 556.34. A daily close below this level would invalidate the stabilization thesis and likely signal a continuation of the prior downtrend. The framework is currently in a weakened state, with the immediate challenge being to hold support around the 585.00 - 593.00 pivots. A breakdown below this area would suggest that sellers are regaining control. For the rebound to regain coherence, it must first reclaim the 617.00 - 622.57 validation zone and then achieve a convincing daily close above the 633.00 friction point. Should the framework confirm with such strength, technical projections point towards higher structural resistances, notably the 650.00 level and the major daily EMA 200, currently located at 705.27.


Breakout: Structural Catalyst Assessment
The Breakout framework is currently not plausible for BNB/USDC as the market structure lacks the necessary preconditions for a structural rupture. The current price action is best described as a low-volatility consolidation following a sharp rejection from the 745 USDC level in late May. A breakout scenario requires a phase of compression directly beneath a well-defined resistance, but the price is currently trading significantly below this major high and key moving averages like the daily EMA 50 (629.08) and EMA 200 (705.27). The technical indicators reflect this lack of directional preparation: the D1 ADX at 15.51 points to a distinct absence of trend, while the D1 RSI at 43.32 shows no building momentum. This reading is further reinforced by the weekly context, where the price remains below its EMA 50 (721.91), suggesting that the broader trend does not currently support a bullish breakout. For this framework to become relevant, a structural shift would be required, involving the price re-engaging with a major resistance zone and building a new, high-compression base.

Continuation: Directional Flow Assessment
The Continuation framework is currently not plausible for BNB/USDC. The market structure has undergone a significant bearish reversal, breaking the prior upward directional flow. This shift is primarily anchored by the powerful weekly bearish engulfing candle from the first week of June, which decisively rejected prices above 700 and established a new bearish precedent. On the daily timeframe, this has translated into price trading consistently below its key structural references, notably the D1 EMA 50 (629.08) and the D1 EMA 200 (705.27). This configuration invalidates the premise of a stable upward continuation. The dynamic context reinforces this reading: the D1 ADX at 15.51 is exceptionally low, indicating a complete lack of a directional trend, while the D1 RSI at 43.32 confirms that momentum remains in bearish territory. For this framework to become relevant, the market would first need to build a new bullish structure by reclaiming key resistance levels like the D1 EMA 50 and establishing a clear pattern of higher highs and lows.
Comparative Framework Verdict
Among the three technical frameworks analyzed, the Range Rebound scenario presents the only plausible structure for BNB/USDC. This view is strongly supported by the market's current state of trend exhaustion, evidenced by a very low ADX reading and a significant drop in volume following the recent sell-off. The price found stabilization at a major weekly support confluence, creating the necessary conditions for a new range to form. In contrast, both the Breakout and Continuation frameworks are deemed not plausible. The Continuation framework is invalidated by the clear bearish structural break below key moving averages, while the Breakout scenario lacks the required price compression against a well-defined resistance. The Range Rebound framework has already been tested. An initial push above its validation zone of 617.00 - 622.57 was met with a swift rejection from the first friction zone around 629.00 - 633.00. This failure has weakened the immediate rebound case and highlights the significant overhead resistance. The market's next moves will be critical in defining the new range. The key levels to monitor are the major structural low at 556.34, which serves as the ultimate invalidation point for the rebound, and the 633.00 resistance, a break of which would be needed to confirm bullish intent.
For broader market context, readers can also review the latest related fundamental analysis for this pair.
For live market monitoring and the full interactive chart, readers can access the dedicated BNB Market Hub.
Disclaimer
CopyTradia provides technical analysis for informational and educational purposes only. This content does not constitute financial advice, investment recommendations, or trading signals. Cryptocurrency markets are highly volatile. Past performance is not indicative of future results. Always conduct your own research (DYOR) and consult a qualified financial advisor before making any investment decisions.


