BNB Range Rebound Analysis: Support Test at Key Resistance
- CopyTradia Intelligence

- Jun 15
- 4 min read
This BNB range rebound analysis examines the current BNB/USDC structure in the context of support defense and weakening alternative frameworks. BNB/USDC is currently navigating a period of technical consolidation around the 616 USDC level, following a sharp rejection from highs earlier in the month. The market structure is characterized by a distinct lack of directional conviction, as evidenced by a low daily ADX reading of 18.15 and a neutral RSI of 47.66. This technical picture of a contained, non-trending environment aligns with recent fundamental observations of contracting volatility after a period of monthly decline. Price action is currently caught between the influence of a major long-term support zone, anchored by the weekly 200-period EMA near 570 USDC, and significant overhead resistance, including the daily 50-period EMA around 632 USDC. This compression sets the stage for a critical test of whether the recent bounce from support can evolve into a more sustained recovery or if the broader bearish pressure will resume control.
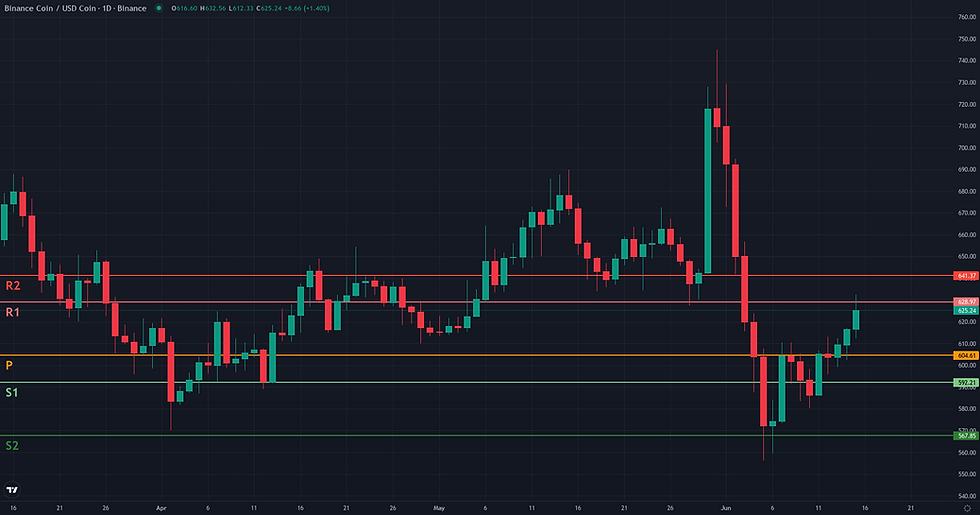
BNB Range Rebound Analysis: Support and Friction Zones
Following the initial stabilization identified in the entry phase, the BNB/USDC rebound framework is now facing its first critical test. The validation of this rebound hinges on the price maintaining its structure above the 580-592 USDC support area, which contains the recent higher low of 580.24 USDC. A definitive breakdown, marked by a daily close below this level, would invalidate the rebound thesis, signaling a failure of buying pressure and likely prompting a re-evaluation of the major weekly lows near 556-570 USDC. Currently, short-term momentum is pushing the price into an immediate and significant friction zone between 629 USDC and 632 USDC. This resistance is a technical confluence of the weekly R1 pivot point (628.97) and the daily 50-period exponential moving average (631.82). The market's reaction here will be telling. A sustained breakout above this area would serve as a strong confirmation, suggesting the rebound has the strength to challenge further resistance, with the next notable friction point around the weekly R2 pivot at 641.37 USDC. Should the rebound successfully navigate these initial obstacles, the broader technical projection points towards the macro resistance cluster between 707 USDC and 722 USDC. This zone is defined by long-term structural anchors, including the daily EMA 200 and the weekly EMA 50. Conversely, a clear rejection from the current 629-632 USDC resistance would be a weakening signal, suggesting the rebound is losing steam and putting the 580-592 USDC validation zone back under pressure.


Breakout: Structural Catalyst Assessment
The Breakout framework is currently not plausible for BNB/USDC. While the daily chart shows a period of price consolidation and volatility contraction following a sharp decline, this structure lacks the fundamental characteristics of a pre-breakout accumulation. The primary obstacle is the overwhelmingly bearish higher-timeframe context. Price was recently and decisively rejected from the $745 level and now trades significantly below the weekly EMA 50 ($721.91), signaling that the medium-term trend remains under pressure. This consolidation is therefore more likely a pause within a downtrend than a base for a new ascent. This interpretation is reinforced by weak internal dynamics: the D1 RSI at 47.66 remains below the neutral 50 mark, and the Volume Oscillator is deeply negative at -50.07%, indicating that the current stability is not supported by renewed buying interest. For a breakout scenario to become relevant, the market would first need to demonstrate a clear shift in character, starting with a sustained reclaim of the resistance cluster around $627-$632 and a parallel resurgence in both momentum and volume.

Continuation: Directional Flow Assessment
The Continuation framework is assessed as not plausible at this time due to a market structure that is fundamentally corrective rather than trending. The recent price recovery from the early June lows, while constructive in the short term, is occurring within a broader bearish context. Price is currently trading below key daily moving averages, specifically the D1 EMA50 at 631.82 and the D1 EMA200 at 707.67, which structurally defines the present environment as a retracement. Furthermore, the weekly chart is dominated by a significant bearish rejection candle from the first week of June, which established a wide trading range and suggests considerable overhead supply. The lack of directional conviction is underscored by weak momentum readings, with the D1 ADX at a low 18.15 and the D1 RSI struggling below the neutral 50 mark at 47.66. For a continuation scenario to become relevant, the price would first need to reclaim key structural levels like the D1 EMA50 and demonstrate a significant and sustained increase in directional momentum.

Comparative Framework Verdict
In comparing the three strategic frameworks, the Range/Rebound scenario emerges as the most plausible technical interpretation for BNB/USDC. Its viability is anchored by the clear price reaction at a major weekly support confluence between 557 and 570 USDC. This bounce is occurring within a market environment that lacks a directional trend, a condition strongly supported by low ADX readings on both daily (18.15) and weekly (19.73) timeframes. For this framework to hold, the price must continue to defend the support area between 580 and 592 USDC, confirming the formation of a potential base. Conversely, both the Breakout and Continuation frameworks were assessed as not plausible. These scenarios are undermined by the prevailing bearish market structure, with the price trading below key daily and weekly moving averages. Furthermore, weak underlying momentum, evidenced by a daily RSI below 50 and a deeply negative Volume Oscillator, indicates a lack of buying conviction required to initiate or sustain a new directional trend. The current consolidation is therefore interpreted as a corrective bounce rather than a prelude to a significant upward move. The immediate focus shifts to the price's interaction with the first major friction zone at 629-632 USDC. A decisive break above this level would add significant weight to the rebound thesis, while a rejection would place the emphasis back on the strength of the 580 USDC support.
For broader market context, readers can also review the latest related fundamental analysis for this pair.
For live market monitoring and the full interactive chart, readers can access the dedicated BNB Market Hub.
Disclaimer
CopyTradia provides technical analysis for informational and educational purposes only. This content does not constitute financial advice, investment recommendations, or trading signals. Cryptocurrency markets are highly volatile. Past performance is not indicative of future results. Always conduct your own research (DYOR) and consult a qualified financial advisor before making any investment decisions.


