BNB Consolidation Analysis: Support After W1 EMA 200 Breakdown

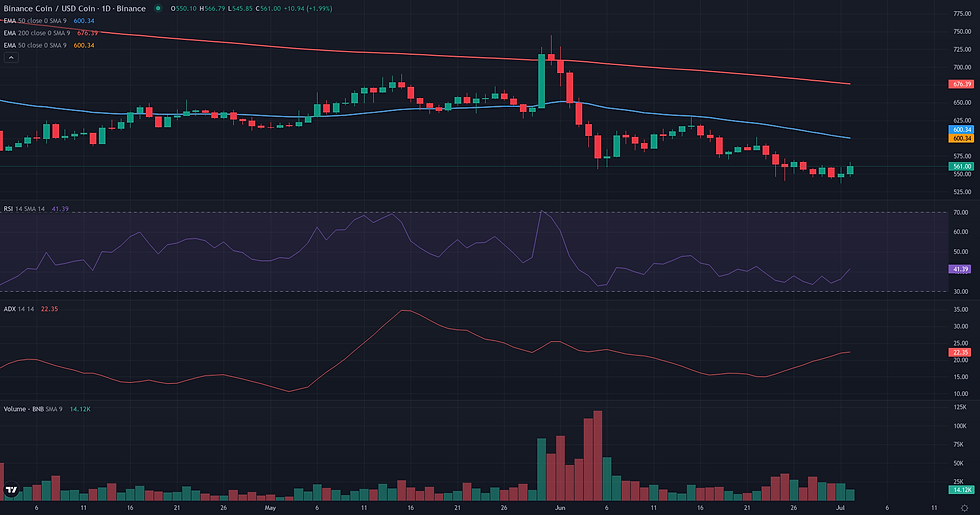
This BNB consolidation analysis examines the current BNB/USDC structure in the context of support defense and weakening alternative frameworks. BNB/USDC is currently navigating a period of technical indecision, consolidating around the 550.00 level after a significant downward move in June. The price is trading below all its key long-term moving averages, including the daily EMA 50 (601.95) and the critical weekly EMA 200 (569.25), signaling a structurally bearish environment. Despite this, the downtrend lacks strong conviction, as indicated by a low daily ADX reading of 22.05, which points to a non-trending or weakening trend state. Momentum indicators reflect this ambiguity; the daily RSI at 36.22 remains in bearish territory but is not yet deeply oversold. This technical consolidation occurs within a broader context of significant price contraction and market-wide "Extreme Fear" sentiment, although recent fundamental analysis noted BNB's relative strength against Bitcoin. The current price action represents a pause, setting the stage for a potential conflict between a technical rebound from support and a continuation of the established downtrend.

BNB Consolidation Analysis: Technical Framework Assessment
Following the borderline assessment of the Range/Rebound framework for BNB/USDC, the resolution analysis focuses on the critical validation zone: a daily close above the W1 EMA 200 at 569.25. This level represents the primary hurdle for any bullish scenario to gain credibility. The framework's coherence would be invalidated if the price fails to hold its recent support base. A daily close below the 538-526 USDC zone, which contains key daily and weekly pivots (D1 S1 at 538.09), would negate the stabilization attempt and likely trigger a continuation of the downtrend. If the rebound attempt gathers strength and pushes towards validation, it will encounter a series of friction zones. The first is the validation level at 569.25 itself. A successful reclaim would then face resistance in the 580-590 USDC area, marked by the W1 R1 pivot (588.24). A more significant structural obstacle lies at the D1 EMA 50 (601.95), a level that capped the recovery in mid-June. A confirmed rebound breaking through these friction points would find its next major technical reference at the W1 R2 pivot of 626.06. Confirmation of the rebound's strength would require not just clearing the W1 EMA 200, but sustaining price action above it. Conversely, a rejection from this key moving average or the formation of new lows on the 4H chart would serve as a strong weakening signal, suggesting the bearish pressure remains dominant.


Breakout: Structural Catalyst Assessment
The Breakout framework is assessed as not plausible for BNB/USDC at this time. The current market structure is fundamentally at odds with the core signature of this strategy, which requires a phase of compression or consolidation beneath a clearly defined resistance level. Instead, the daily chart reveals a distinct short-term downtrend that has been in place for the past month, characterized by a series of lower highs and lower lows. The price is currently trading far from any potential breakout ceiling, positioned well below key resistance markers such as the W1 EMA200 at 569.25 and the D1 EMA50 at 601.95. This structural weakness is corroborated by momentum indicators; both the daily RSI (36.22) and weekly RSI (36.74) are in bearish territory, signaling an absence of the underlying strength needed to initiate and sustain a structural break. Compounding this, the D1 Volume Oscillator at -0.52 points to waning market participation, which is contrary to the accumulation of interest typically seen before a significant upward move. For this framework to become relevant, a structural reversal is required: the downtrend must first be neutralized, followed by the construction of a stable price range directly challenging a key overhead resistance.

Continuation: Directional Flow Assessment
The technical structure for BNB/USDC presents a borderline case for a bearish continuation. The primary argument in favor of this framework is the dominant bearish market structure visible on both daily and weekly charts. Following a sharp decline in early June, the price has established a clear series of lower highs and lower lows. This downtrend has pushed the price below all key moving averages, most notably the weekly 200-period EMA at 569.25, a critical long-term structural level. This breakdown, combined with bearish RSI readings on both timeframes (D1 RSI at 36.22), suggests a stable directional flow to the downside. However, the reading is weakened by a lack of dynamic confirmation. The D1 ADX at 22.05 indicates the trend is not yet strongly established, and the negative D1 Volume Oscillator (-0.52) reveals that the recent drop was not supported by high participation. Furthermore, a short-term counter-trend rally is currently in progress, testing the broken W1 EMA200 from below. The framework's plausibility hinges on whether this level, now acting as resistance, can cap the current bounce and force a resumption of the downtrend.
Comparative Framework Verdict
The analysis of the three technical frameworks reveals a market at a structural crossroads, with no single scenario being dominant. The Breakout framework is assessed as not plausible, as the current price action is a downtrend followed by consolidation, not the required compression of volatility under a clear resistance level. This leaves two competing, borderline-plausible scenarios. The Range/Rebound framework is considered borderline, drawing support from tactical signals like oversold D1 Stochastics and price testing the lower Bollinger Bands. However, its validity is seriously challenged by the fact that BNB is trading below the critical weekly 200-period EMA (~569.25), a major long-term structural weakness. Conversely, the bearish Continuation framework is also rated borderline. It is supported by this very structural breakdown and the clear pattern of lower highs, but is weakened by a lack of strong trend momentum, confirmed by low ADX readings. The market's direction likely hinges on the resolution around the 569.25 level. A failure to reclaim this zone would reinforce the bearish case, while a sustained move back above it would lend significant credibility to a rebound.
For broader market context, readers can also review the latest related fundamental analysis for this pair.
For live market monitoring and the full interactive chart, readers can access the dedicated BNB Market Hub.
Disclaimer
CopyTradia provides technical analysis for informational and educational purposes only. This content does not constitute financial advice, investment recommendations, or trading signals. Cryptocurrency markets are highly volatile. Past performance is not indicative of future results. Always conduct your own research (DYOR) and consult a qualified financial advisor before making any investment decisions.


