AVAX Downtrend Oversold Analysis: Conflict at Critical Juncture
- CopyTradia Intelligence

- Jun 25
- 4 min read
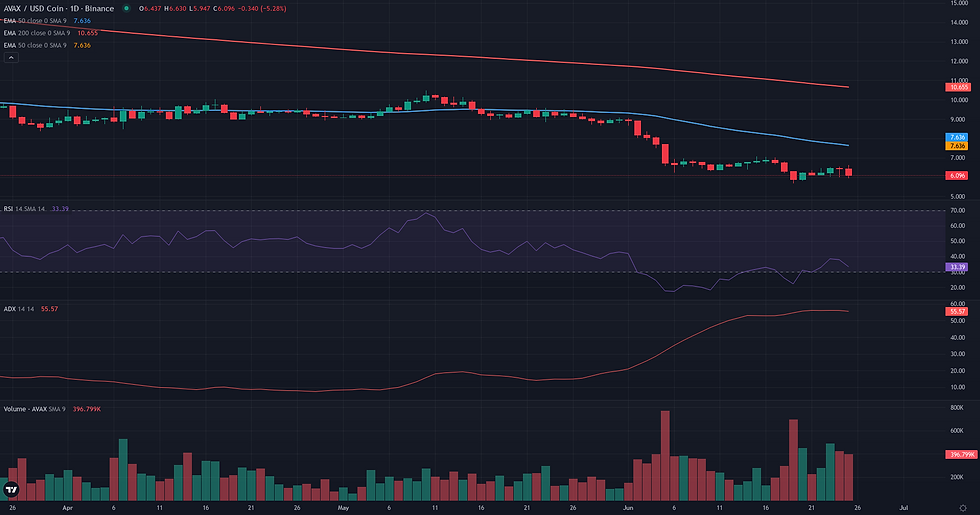
This AVAX downtrend oversold analysis examines the current AVAX/USDC structure in the context of support defense and weakening alternative frameworks. AVAX/USDC is currently in a state of high technical tension, caught between a powerful, mature downtrend and emerging signs of momentum exhaustion on a higher timeframe. The daily chart shows price consolidating near 6.44 after a sharp decline to a weekly low of 5.68. The strength of the bearish trend remains undeniable, evidenced by an extremely high D1 ADX of 56.08 and price trading significantly below its key daily moving averages, the EMA 50 at 7.70 and EMA 200 at 10.80. However, this bearish structure is being challenged by the weekly RSI, which has fallen into oversold territory at 29.30, a classic signal of potential trend exhaustion. This technical stabilization occurs within a fundamental context of 'Extreme Fear' and a persistent short bias in derivatives markets, suggesting the current pause is a fragile balance. The market is therefore poised at a critical juncture, where the resolution of this conflict will likely define the next significant directional move.

AVAX Downtrend Oversold Analysis: Technical Framework Assessment
The resolution for the AVAX/USDC rebound framework, initially deemed borderline, depends on whether the current stabilization can evolve into a credible recovery. Starting from the validation zone of [5.81 - 6.01], which represents the immediate support above the recent capitulation low, the market structure is at a critical juncture. The primary condition for the framework's invalidation is a decisive failure to hold this base, specifically a D1 close below the swing low of 5.68 USDC. Such a move would negate the stabilization and signal a continuation of the powerful downtrend that remains active on a higher timeframe. Before any significant recovery can occur, the price must navigate through several layers of resistance. The first friction zone lies between 6.54 and 6.65 USDC, an area defined by recent 4H highs and the D1 R1 pivot. Clearing this level is the minimum requirement for confirming bullish intent. Beyond that, a more substantial obstacle is located around 6.90 - 7.08 USDC, which includes the W1 R1 pivot and prior structural highs. If the rebound successfully overcomes these hurdles, the primary technical projection zone is the 7.68 - 7.70 USDC region, a significant confluence of the W1 R2 pivot and the D1 EMA 50. A confirmation of the framework's strength would involve a sustained D1 close above 6.65 USDC. Conversely, a clear rejection from this same level, followed by a drop below the W1 pivot at 6.29, would serve as a weakening condition, suggesting the rebound attempt is failing.


Breakout: Structural Catalyst Assessment
The Breakout framework is currently not plausible for AVAX/USDC. The market structure is dominated by a strong, multi-timeframe bearish trend, which fundamentally contradicts the premise of a bullish structural break. Price is trading significantly below its daily EMA 50 (7.70) and weekly EMA 50 (13.98), establishing these levels as distant overhead resistance rather than immediate breakout targets. The recent price action is not a pre-breakout compression but rather a low-level consolidation following a significant price decline. This interpretation is reinforced by momentum indicators; the D1 ADX at a very high 56.08 confirms the strength of the existing downtrend, while the D1 RSI at 37.90 shows a distinct lack of bullish momentum. For this framework to become relevant, the market would first need to neutralize the current bearish pressure by establishing a clear bottoming structure and reclaiming key resistance levels, accompanied by a notable shift in momentum dynamics.

Continuation: Directional Flow Assessment
The technical structure for AVAX/USDC presents a borderline case for a bearish continuation. On one hand, the dominant directional flow is unambiguously negative. The daily price action is firmly anchored below key structural moving averages, including the D1 EMA 50 at 7.70 and the D1 EMA 200 at 10.80. This bearish alignment is confirmed by the weekly chart, where price also trades substantially below its own major averages. The strength of this downtrend is underscored by a very high D1 ADX reading of 56.08, indicating a powerful and mature trend. However, this strong structural reading is tempered by a critical momentum factor: the weekly RSI has entered oversold territory at 29.30. This suggests the bearish trend is extended on a higher timeframe and may be vulnerable to exhaustion. The current price action reflects this tension, as it is engaged in a multi-day consolidation after establishing a new low at 5.68. This creates a conflict between the strong underlying structure favoring continuation and the momentum indicators cautioning against immediate follow-through, rendering the framework borderline.
Comparative Framework Verdict
Comparing the three strategic frameworks for AVAX/USDC reveals a market defined by a direct conflict between trend and momentum, leading to two equally plausible but opposing scenarios. Both the Range/Rebound and the bearish Continuation frameworks are rated as borderline. This shared verdict stems from the same core tension: a powerful, structurally confirmed downtrend (high D1 ADX, price below key MAs) is clashing with significant momentum exhaustion signals, particularly the oversold Weekly RSI. The Range/Rebound framework focuses on the potential for a relief rally, anchored by the recent price stabilization above the capitulation low of 5.68 and validated by holding the [5.81 - 6.01] support zone. Conversely, the Continuation framework posits that this stabilization is merely a temporary pause before the dominant downtrend resumes. Given that both scenarios hinge on the resolution of the same technical conflict, neither can be considered dominant at this stage. The Breakout framework is assessed as not plausible. The current market structure is characterized by a strong directional trend, not the sideways price compression and energy build-up that typically precedes a structural breakout. The key element to monitor will be the market's reaction around the recent lows. A successful defense could validate the rebound case, while a failure would confirm the continuation of the bearish trend.
For broader market context, readers can also review the latest related fundamental analysis for this pair.
For live market monitoring and the full interactive chart, readers can access the dedicated AVAX Market Hub.
Disclaimer
CopyTradia provides technical analysis for informational and educational purposes only. This content does not constitute financial advice, investment recommendations, or trading signals. Cryptocurrency markets are highly volatile. Past performance is not indicative of future results. Always conduct your own research (DYOR) and consult a qualified financial advisor before making any investment decisions.


