AVAX Bearish Continuation: Support Break Confirms Downtrend
- CopyTradia Intelligence

- Jun 4
- 4 min read
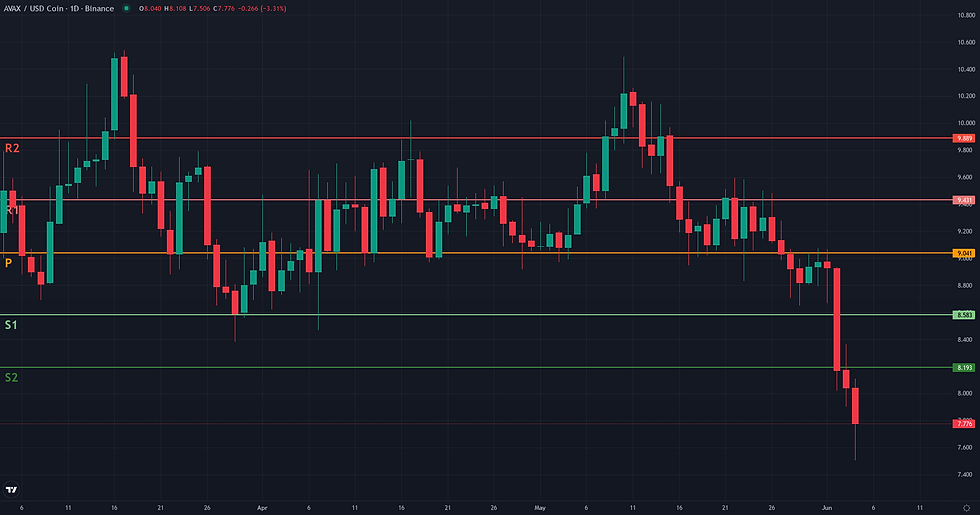
This AVAX bearish continuation examines the current AVAX/USDC structure in the context of support defense and weakening alternative frameworks. Avalanche (AVAX/USDC) is currently navigating a strongly bearish technical environment, having broken decisively below key support levels. The daily chart shows a market in a state of downward acceleration, with the price closing at 8.04 after breaching the significant 8.65 support zone. This move is underscored by strong momentum indicators; the ADX on the daily timeframe has risen to 25.78, signaling a strengthening trend, while the RSI has dipped into oversold territory at 28.07. This suggests the bearish pressure is intense, though potentially overextended in the short term. This technical breakdown occurs within a broader market context of deteriorating sentiment, as described in the latest fundamental analysis, where a lack of conviction has left the asset vulnerable to sellers. Price is trading substantially below all key short and long-term moving averages, confirming that sellers are in firm control of the market structure.
Range & Rebound: Market Structure Assessment
The Range/Rebound framework is currently not plausible for AVAX/USDC. The market structure is defined by a dynamic breakdown rather than the controlled stabilization this framework seeks to identify. Recent price action shows two consecutive large bearish candles that have decisively broken through recent support levels around 8.65 and the D1 lower Bollinger Band, which stood at 8.32. This move is supported by a significant increase in volume (Volume Oscillator at 24.99) and a rising ADX (25.78), collectively signaling the start of a new bearish leg, not a period of consolidation. While the D1 RSI has entered oversold territory at 28.07, this signal is currently isolated and insufficient to counter the strong structural evidence of a breakdown. In this context, an oversold reading points more to the intensity of the current trend than to an imminent reversal. For the Range/Rebound framework to become relevant, the downward momentum would need to cease, followed by price reclaiming the 8.65 level and establishing a clear consolidation pattern.

Breakout: Structural Catalyst Assessment
The Breakout framework is currently not plausible for AVAX/USDC. The market structure does not exhibit the necessary preconditions of consolidation or energy compression beneath a defined resistance level. Instead, the daily chart displays a clear breakdown dynamic. Price has recently accelerated to the downside, breaching the lower D1 Bollinger Band (8.32) and now testing the 20-day low at 7.90. This move is supported by strong bearish momentum, as evidenced by a D1 RSI of 28.07, which is in oversold territory. Furthermore, the increased volume on the last two negative sessions confirms the selling pressure. This bearish daily structure is embedded within a dominant weekly downtrend. With the price trading significantly below its key weekly moving averages, such as the W1 EMA 50 at 14.92, any potential bullish breakout would face substantial long-term resistance. For the Breakout framework to become relevant, the current downward momentum would first need to cease, followed by the formation of a new consolidation base. A reclaim of key structural levels, such as the area around 9.05-9.22 (D1 middle Bollinger Band and EMA 50), would be a preliminary step toward re-evaluating this framework.

AVAX Bearish Continuation: Directional Flow Assessment
The technical structure for AVAX/USDC presents a plausible case for a bearish continuation. The daily chart exhibits a clear and stable directional flow to the downside, with the price positioned well below key structural moving averages such as the D1 EMA 50 (9.22) and EMA 200 (11.81). This downtrend has recently accelerated, evidenced by the decisive break of a multi-day support level around 8.65. This breakdown on June 2nd and 3rd was accompanied by a significant increase in volume, as highlighted by the Volume Oscillator (24.99), suggesting strong participation and conviction behind the move. The D1 ADX at 25.78 further supports this view, indicating that the bearish trend is strengthening. This daily dynamic is fully coherent with the weekly context, which shows a long-established downtrend (W1 ADX: 34.77). The only minor element of caution is the D1 RSI reading of 28.07, which has entered oversold territory. While this could imply the potential for a temporary pause or a minor technical bounce, it does not, at this stage, challenge the integrity of the dominant bearish structure.

Comparative Framework Verdict
Comparing the three technical frameworks, the Bearish Continuation scenario emerges as the only plausible interpretation of the current market structure for AVAX/USDC. This framework aligns directly with the observed price action: a clear, high-volume breakdown below the recent support level at 8.65. The strengthening daily ADX (25.78) and the alignment with the dominant weekly downtrend provide strong, multi-timeframe confirmation for this thesis. The framework's validity is contingent on the price remaining below the broken support zone, now acting as resistance, between 8.65 and 8.93. In contrast, both the Range/Rebound and Breakout frameworks are assessed as not plausible. The market is not exhibiting the necessary conditions of stabilization or consolidation. Instead of ranging, the price is in a state of bearish expansion, invalidating the Range/Rebound premise. Similarly, the absence of any price compression under a resistance level makes the Breakout framework inapplicable. The only point of caution for the dominant continuation view is the oversold D1 RSI, which could signal a short-term pause or a minor corrective bounce. However, this factor is not significant enough to challenge the overwhelming evidence supporting a continued bearish trend.
For broader market context, readers can also review the latest related fundamental analysis for this pair.
For live market monitoring and the full interactive chart, readers can access the dedicated AVAX Market Hub.
Disclaimer
CopyTradia provides technical analysis for informational and educational purposes only. This content does not constitute financial advice, investment recommendations, or trading signals. Cryptocurrency markets are highly volatile. Past performance is not indicative of future results. Always conduct your own research (DYOR) and consult a qualified financial advisor before making any investment decisions.


