Chainlink Positioning Builds Amidst Lower Volatility
- CopyTradia Intelligence

- May 8
- 3 min read
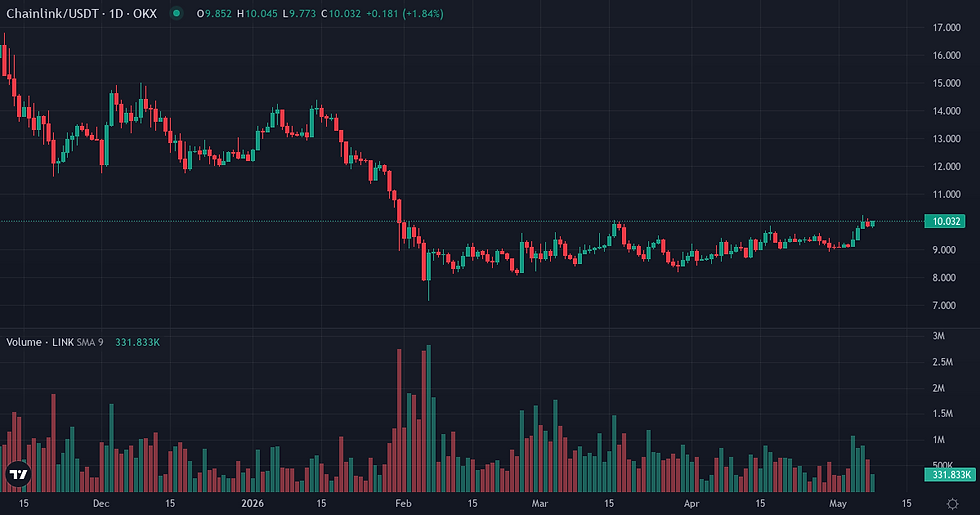
Chainlink experienced notable price appreciation over the past week, with its market gaining 8.77%. This upward movement occurred as speculative interest in Chainlink positioning expanded, evidenced by a significant increase in Open Interest and sustained positive funding rates. However, this occurred within a context of reduced volatility and mixed relative performance against Bitcoin over different timeframes.
LINK Price Action and Volatility
LINK recorded an 8.77% price increase over the last seven days, extending its 30-day gain to 8.82%. This recent upward momentum contrasts with its substantial historical distance from its all-time peak, currently at an 80.99% drawdown. Realized volatility for the 7-day period stood at 38.51%, and 30-day at 41.04%, both significantly below the 90-day baseline of 62.32%, indicating a calmer price environment despite the gains. Against Bitcoin, LINK outperformed by 3.5472% over the past week, shifting its 30-day relative underperformance of -2.7292%. The 30-day correlation with Bitcoin has also decreased to 0.7612 from its 90-day baseline of 0.8769, suggesting a degree of independent price action.

Metric | Value |
LINK Price | $10.02 (+1.61% 24h / +8.77% 7d / +8.82% 30d) |
Volume 24h | $327.8M |
Native Quote Vol. 24h | $6.2M |
Market Cap | $7.28B |
Market Cap Rank | 19 |
Circulating Supply | 727.10M LINK |
ATH Distance | 80.99% below ATH |
Metric | Value |
LINK/BTC Ratio | 0.000124 |
Relative Perf. 7d vs BTC | +3.55% |
Relative Perf. 30d vs BTC | -2.73% |
Derivatives: Open Interest and Funding
Speculative interest in LINK derivatives expanded, with Open Interest increasing by 15.45% over the last seven days to reach $0.100 billion, notably above its 90-day baseline of $0.080 billion. This expansion was accompanied by a positive funding rate, which recorded a 7-day cumulative value of 0.059811% and a 30-day Z-score of 1.0120, indicating that current funding is above its 30-day average. The liquidation profile over the past seven days showed a balanced distribution, with long liquidations accounting for 52.3% ($3.9M) and short liquidations for 47.7% ($3.5M), consistent with the balanced directional skew observed over the 30-day average. The overall liquidation intensity remained low at 0.001015, suggesting no immediate signs of extreme market stress from forced closures.
Metric | Value |
Funding Rate (current) | +0.0100% |
Funding Cumul. 7d | +0.0598% |
Open Interest | $0.10B (+15.45% 7d) |
Liq. 24h Longs | $0M |
Liq. 24h Shorts | $0M |
Liq. 7d Longs | $4M |
Liq. 7d Shorts | $4M |
Metric | Value |
Realized Vol 7d | +38.51% (90d avg: +62.32%) |
Realized Vol 30d | +41.04% |
Corr. BTC 30d | 0.7612 (90d avg: 0.8769) |
Beta vs BTC | 0.8163 |
Volume Momentum | 1.0320x |
Funding Z-Score 30d | 1.01σ |
Turnover Ratio | 0.0450 |
Liq. Intensity | 0.00101 |
Key Factors for LINK Sustainability
Monitoring the sustainability of Chainlink's recent price appreciation will be key, particularly whether it can maintain its positive relative strength against Bitcoin, given the prior 30-day underperformance and the reduced correlation. A second condition involves observing how the expanding Open Interest and positive funding rates evolve; a continued increase without corresponding price acceleration could indicate an increasingly crowded long positioning, while a sharp reversal could signal deleveraging. Finally, the broader crypto market sentiment, currently in "Fear" and deteriorating, alongside pending macro data releases such as Non-Farm Employment Change and Unemployment Rate, could introduce external pressures that interact with LINK's internal dynamics, potentially influencing its current low volatility regime.
Indicator | Value | Variation |
Broad Dollar Index | 118.39 | flat (7d) |
US 10Y Yield | 4.36% | -0.03pp (7d) |
Fed Balance Sheet | $6710B | +$9,555M (7d) |
M2 Money Supply | $22,686B | +$58.7B (1m) |
Fear & Greed | 38 (Fear) | -1 pts (7d) |
Fear & Greed Index: Alternative.me
Chainlink Weekly Takeaway
Chainlink concludes the week in a state characterized by recent autonomous price strength and a notable expansion of leveraged positioning, yet within a subdued volatility environment. The divergence between its short-term outperformance against Bitcoin and its longer-term underperformance, coupled with a decreasing correlation, suggests a market seeking its own trajectory. The build-up in Open Interest and sustained positive funding indicates a clear directional bias from derivatives participants, but the low liquidation intensity suggests this positioning is not yet under significant stress. This configuration implies that while the asset has demonstrated independent momentum, the sustainability of this trend will depend on whether the underlying demand can absorb the increased speculative exposure without triggering significant deleveraging.
Disclaimer
This article provides a purely analytical perspective on Chainlink's market dynamics and does not constitute investment advice or a recommendation to buy or sell any asset.

Comments